

Pi Network Price Prediction: 3 Bearish Signs Emerge Ahead of November Ecosystem Summit
Pi Network (PI) is under renewed selling pressure ahead of its first-ever ecosystem summit, which is set to take place between November 17 and 19, 2026. PI dropped 1.45% to trade around $0.0689 on November 13, mirroring weakness across the wider cryptocurrency market. Bitcoin (BTC) dropped below $70,000 and Ethereum (ETH) also traded below $2,000.
While the upcoming summit could see positive developments and attract investor attention, three bearish indicators suggest that PI faces significant challenges in its recovery. Extreme market fear, falling risk-adjusted returns and negative technical momentum limit chances for a sustainable price recovery.
1. Extreme Fear Sentiment Puts Pi Network Price Under Pressure
One of the biggest challenges that Pi Network faces is the declining sentiment in the cryptocurrency market. The Crypto Fear and Greed Index has plunged to 20, marking extreme fear, and hitting the lowest level in approximately a month.
The sentiment reflects growing uncertainty among cryptocurrency investors as major digital currencies experience steep price declines. When market participants become fearful, they typically de-risk by reducing exposure to risk assets, rather than by making new investments or selling existing positions to protect capital.

This adds more pressure on Pi Network ahead of the ecosystem summit on November 17. Despite the event’s new ecosystem developments, weak market confidence could hamper PI from getting enough buying demand.
Moreover, traders could use any short-term price bounce to take profits instead of holding their positions. This selling pattern may limit any potential gains and prevent PI from building a sustainable upward trend.
**2. A Falling Sharpe Ratio Signals Poor Returns for Investors
Another bearish sign is the decreasing Sharpe ratio of Pi Network, which assesses the investment returns against the degree of risk taken by holders.
Blockworks data shows that the 90 day average Sharpe ratio for PI has fallen to -2 and the one year average is now -1.4. The negative readings mean that the token has performed terribly on a risk-adjusted basis.
The softness comes after PI recently plunged to an all-time low of about $0.0625 on November 9. The token has since recovered about 10% from that level but remains trading around 97% below its all-time high of $2.98.
When the Sharpe ratio is negative, investors may decide not to take exposure because the potential rewards are not enough to justify the risks incurred. Thus, those already holding may want to sell on any short-term rallies, particularly if the upcoming summit does not produce developments supportive of market confidence.
The metric is therefore important for following up on the possibilities of recovery of the Pi Network.
**3. Technical Indicators Continue Bearish Momentum
Technical indicators on Pi Network’s daily chart also indicate that sellers are still in charge.
PI is still in bearish territory with the Relative Strength Index (RSI) at 34. Although the indicator was close to the oversold zone of 30, it has not yet demonstrated a convincing momentum reversal.
Meanwhile, the On-Balance Volume (OBV) indicator has fallen to around -3.28 billion. This read shows ongoing softness in buying activity versus selling pressure.
Taken together, these metrics suggest that PI has yet to build enough bullish momentum to support a sustained recovery.
However, the technical picture could improve if RSI starts making higher highs and OBV turns up. Moves such as these would be a sign of improving buying pressure and could strengthen the bullish case ahead of the summit.
4. Pi Network Price Prediction: Key Support and Resistance Levels
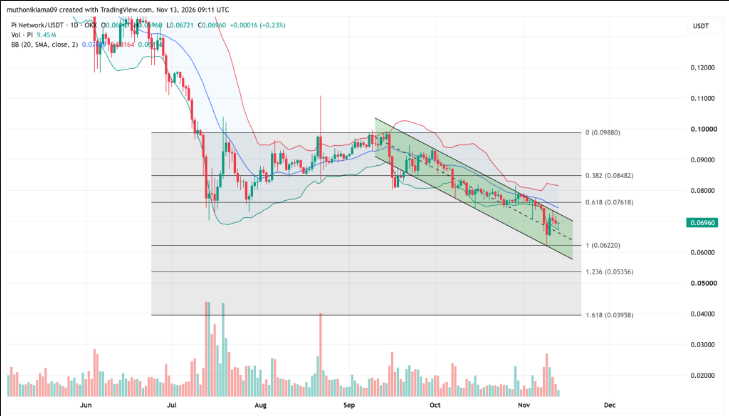
The daily chart of the Pi Network shows that the general downward trend that started in September is still intact. There are a few key price levels investors should watch ahead of the Nov. 17-19 ecosystem summit.
**Key downside levels
- $0.0622–$0.0625: The area is a recent all-time low and an important support zone. It is also at the lower boundary of the falling channel. – $0.053: If PI slips below its recent low, the 123.6% Fibonacci extension is another possible downside target.
Possible recovery levels - $0.0743: The middle Bollinger Band is the first important recovery target. – $0.076: This level is equivalent to the 61.8% Fibonacci retracement and could act as resistance on the upside. – $0.084: A sustained move above this level would make a higher high and give stronger evidence of a possible bullish reversal.
Meaningful ecosystem developments announced by the team at the upcoming summit could help improve investor sentiment. But weakness in the wider cryptocurrency market may cap buying demand.
Conclusion: Is PI Ahead of the Ecosystem Summit?
Pi Network is displaying three major bearish signs ahead of its ecosystem summit, scheduled for November 17-19. The signs are extreme fear in the market, falling Sharpe ratio, and negative technical momentum.
PI has bounced off recent all-time low but the bigger downtrend remains intact. A move below $0.0622 may open up the $0.053 level, while a recovery toward $0.0743 and $0.076 would suggest improving momentum. For a more significant bullish reversal, PI will have to close above $0.084 on convincing buying volume.