In this article, I will cover the Indicators Every Crypto and Forex Trader Should Master, crucial for managing tumultuous markets.
All traders, whether in cryptocurrencies or forex, should know these indicators and their functions for trend identification, momentum measurement, volatility assessment and decision-making.
Effectively understanding and applying these indicators is fundamental to increasing precision within trades and obtaining maximum possible gains.
Key Points & Indicators Every Crypto and Forex Trader Should Master
| Indicator | Key Points |
|---|---|
| Moving Averages (SMA & EMA) | Identify trends; SMA gives average price; EMA responds faster to recent price changes. |
| Relative Strength Index (RSI) | Measures overbought/oversold conditions; divergence signals trend reversals. |
| Moving Average Convergence Divergence (MACD) | Trend-following momentum; crossovers signal buy/sell; divergence shows weakening trends. |
| Bollinger Bands | Shows volatility; price near bands indicates overbought/oversold; “squeeze” signals potential breakout. |
| Fibonacci Retracement | Highlights support/resistance zones; helps identify entry, exit, and stop-loss levels. |
| Stochastic Oscillator | Indicates overbought/oversold conditions; %K and %D crossovers generate buy/sell signals. |
| On-Balance Volume (OBV) | Tracks buying/selling pressure; confirms trend strength with volume changes. |
| Volume Moving Average | Smooths daily volume; identifies trend shifts in trading activity. |
| Ichimoku Cloud | Shows support/resistance, trend direction, and momentum; all-in-one indicator. |
| Average True Range (ATR) | Measures market volatility; helps in setting stop-loss and position sizing. |
| Parabolic SAR | Highlights potential trend reversals; dots above/below price signal bearish/bullish moves. |
| Commodity Channel Index (CCI) | Detects overbought/oversold conditions; identifies cyclical trends in markets. |
| Pivot Points | Determine potential support/resistance levels; widely used for intraday trading. |
| ADX (Average Directional Index) | Measures trend strength; above 25 indicates strong trend, below 20 signals weak trend. |
| Chaikin Money Flow (CMF) | Combines price and volume to detect accumulation/distribution; positive CMF signals buying pressure. |
Indicators Every Crypto and Forex Trader Should Master
1. Moving Averages (SMA & EMA)
Moving averages serve as the foundation of technical analysis. The Simple Moving Average (SMA) averages the price data over consecutive time periods, producing an averaging line.
This line helps to eliminate and quieten the excessive noise of the market. The Exponential Moving Average (EMA) focuses more on the newest prices.

This makes the EMA more sensitive and responsive to the current market activity. Moving averages assist traders with determining the market’s trending direction.
Features Moving Averages (SMA & EMA)
- Smooths price data to identify trends.
- SMA calculates average price over a period; EMA gives more weight to recent prices.
- Useful for spotting support and resistance levels.
- Helps confirm trend direction (bullish above, bearish below).
2. Relative Strength Index (RSI)
As a type of oscillator, the Relative Strength Index (RSI) calculates the velocity and fluctuations of price movement. It goes from 0 to 100.
Values greater than 70 are considered to be overbought, and below 30 is considered to be an oversold market. It is mainly used to estimate possible market reversals and can also be used for trend continuations.

If there are signs of divergence, especially price moving contrary to RSI, it is a sign of trend weakness.
The RSI can be used in almost any market which helps traders set better risk-adjusted returns by optimizing their entry and exit in ranging and trending markets.
Features Relative Strength Index (RSI)
- Momentum oscillator ranging from 0 to 100.
- Signals overbought (above 70) and oversold (below 30) conditions.
- Detects divergences for potential trend reversals.
- Useful in trending and range-bound markets.
3. Moving Average Convergence Divergence (MACD)
As a trend-following indicator, the Moving Average Convergence Divergence (MACD) exposes the correlation of two Moving Averages. The indicator has three major parts, the MACD line, the signal line, and the histogram.
When the MACD line crosses above the signal line, it is an entry signal. When the MACD line crosses below the signal line, it is an exit signal. It is also possible to identify the change of momentum by analyzing the histogram.

If the MACD and price are diverging, it is a sign of trend weakness. The combination of trend-following and momentum analysis is why it is so popular among crypto and forex traders.
Features Moving Average Convergence Divergence (MACD)
- Shows the relationship between two EMAs (12 & 26 periods).
- MACD line crossing signal line indicates buy/sell signals.
- Histogram visualizes momentum strength.
- Detects trend reversals through divergence.
4. Bollinger Bands
Bollinger Bands consist of a moving average, an upper, and a lower standard deviation to determine volatility. When the price touches the upper band, the asset may be considered overbought.
Conversely, the lower band may indicate an oversold condition. Traders utilize these bands to detect breakout opportunities during low volatility periods that are called ‘squeezes’.

They assist in defining price range targets and stop-loss placements. Price interaction with the bands can indicate trend continuations or reversals.
This flexibility allows traders to effectively utilize Bollinger Bands to manage their risk in both crypto and forex.
Features Bollinger Bands
- Consists of a moving average with upper and lower volatility bands.
- Upper band signals potential overbought conditions; lower band indicates oversold.
- Bands increase in width during periods of high volatility and decrease in width during periods of low volatility.
- Squeeze patterns indicate possible breakouts.
- Identifying support and resistance, as well as trend continuation, is also aided.
5. Fibonacci Retracement
Fibonacci retracement capitalizes on the Fibonacci sequence to determine possible corrections of price movements. Most popular are the 23.6%, 38.2%, 50%, 61.8%, and 78.6% ranges.
Fibonacci levels are used to optimize entry and exit timing, profit target setting, stop-loss placement, and trend losses in volatile markets.
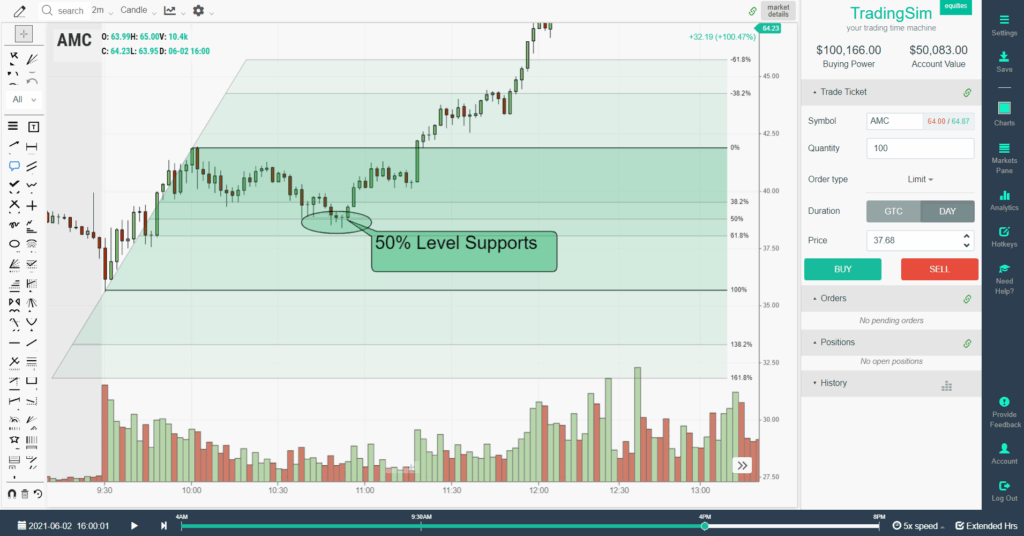
As price trends, retracement levels frequently serve as areas where the price pauses, and/or reverses.
Reliably combining Fibonacci retracement with additional indicators heightens its utility, and is a primary reason why it remains popular with crypto and forex traders.
Features Fibonacci Retracement
- Support and resistance are identified using 23.6%, 38.2%, 50%, 61.8%, and 78.6% key levels.
- Entering during pullbacks can be timed.
- Sets target levels and stop-loss.
- Works well in trending markets.
- Pairs well with other indicators for increased probability trades.
6. Stochastic Oscillator
The Stochastic Oscillator is an indicator of an asset’s momentum and how it closes relative to its range of prices over some time.
Its value is between 0 and 100, where values greater than 80 indicate overbought conditions while those less than 20 show markets that are oversold.

Crossover of the %K and %D lines are taken as buy or sell signals. It is best used for identifying trend reversals in highly volatile conditions.
It is used along with the RSI for further confirmation, which makes it highly useful in trading strategies for both crypto and forex and adds significant value to the traders’ strategies.
Features Stochastic Oscillator
- Momentum indicator that compares the closing price vs. its price range.
- Over 80 is considered overbought; under 20 is considered oversold.
- Buy and sell signals are generated by crossing of the %K and %D lines.
- Helps in capturing reversals within volatile market conditions.
- Pairs well with the RSI for additional confirmation.
7. On-Balance Volume (OBV)
OBV is an indicator that focuses on volume and measures the buying and selling pressure. It calculates the net volume in a specified time period by adding volume on days with price gains and subtracting it on days with price losses.
It shows an increase in OBV and signals that there is accumulation of the asset which is followed by bullish price movement, whereas a decrease shows asset distribution and a bearish price movement.

Its effectiveness in confirming price trends or predicting reversals has simplified trading, especially in crypto and forex, by providing an understanding of the volume in relation to the prevailing trend.
Features On-Balance Volume (OBV)
- Volume based selling and buying pressure is calculated.
- Volume is added on up days and deducted on down days.
- Bullish OBV suggests accumulation, while bearish OBV suggests distribution.
- Helps in trend and reversal confirmation.
- Trend validation is simple, yet effective.
8. Volume Moving Average
The Volume Moving Average assesses market action by smoothing the daily trading volume of a security over a defined time period.
When the trading volume spike occurs well above the average volume level, one can infer the strength of a price move.

Weak volumes accompanying a price move will suggest weak momentum or market indecision. Traders use the Volume Moving Average to confirm potential breakouts, evaluate the strength of prevailing trends, and assist in the risk management of trades.
With well-defined price patterns, volume analysis aids in more accurate trade entry and exit timing, including stop-loss placement, especially for active crypto and forex traders.
Features Volume Moving Average
- Daily trading volume is smoothed over time.
- Confirmation of price movement is provided with volume spikes.
- Weak trends or indecision in the market are indicated with low volume.
- Helps in the validation of breakouts and reliability of the trend.
- Assists with the timing of entries and exits, in addition to managing trade risk.
9. Ichimoku Cloud
The Ichimoku Cloud is a comprehensive indicator that offers a view on a market’s trend, momentum, and key supports and resistances.
It is made up of the Tenkan-sen, Kijun-sen, Senkou Span A & B, and Kumo, which forms the cloud. When price is above the cloud, market sentiment is bullish, and when below the cloud, sentiment is bearish.
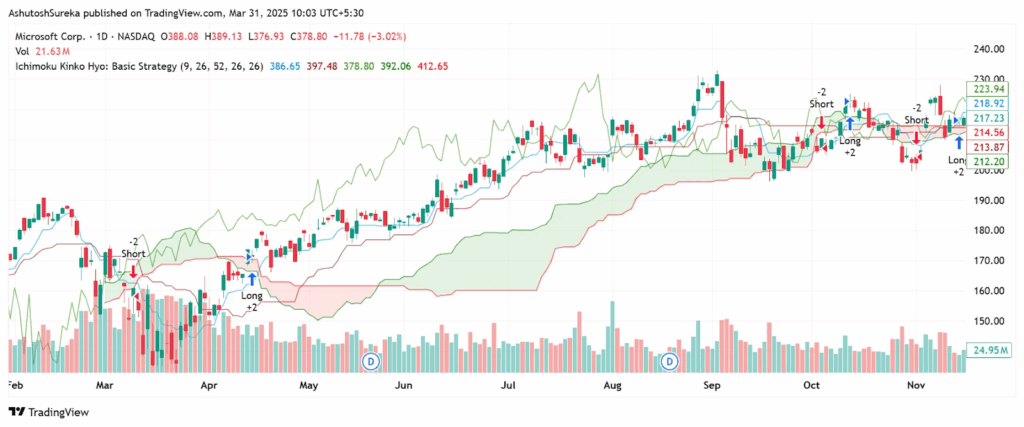
Additionally, the cloud can be used to determine dynamic support and resistance. The Ichimoku Cloud aids crypto and forex traders in assessing possible trend reversals and determining the strength of active trends, which is vital when trading.
Features Ichimoku Cloud
- Multi-line display that encompasses trend, support/resistance, and momentum.
- Prices above the cloud indicate bullish trends, and below the cloud indicate bearish trends.
- Kumo is dynamic support/resistance.
- Displays the trend strength with quick visual representations.
- Identifies potential reversals and trade opportunities.
10. Average True Range (ATR)
The Average True Range (ATR) indicators quantifies price fluctuation by assessing volatility over a defined timeframe. Generally, the greater the ATR, the higher the market volatility; the smaller the ATR, the lower the volatility.
ATR assists a trader in determining the total dollar amount for a trade, the profit dollar amount, the distance for a stop-loss, and the placement of a stop-loss. ATR does not provide a signal for the direction of the market.
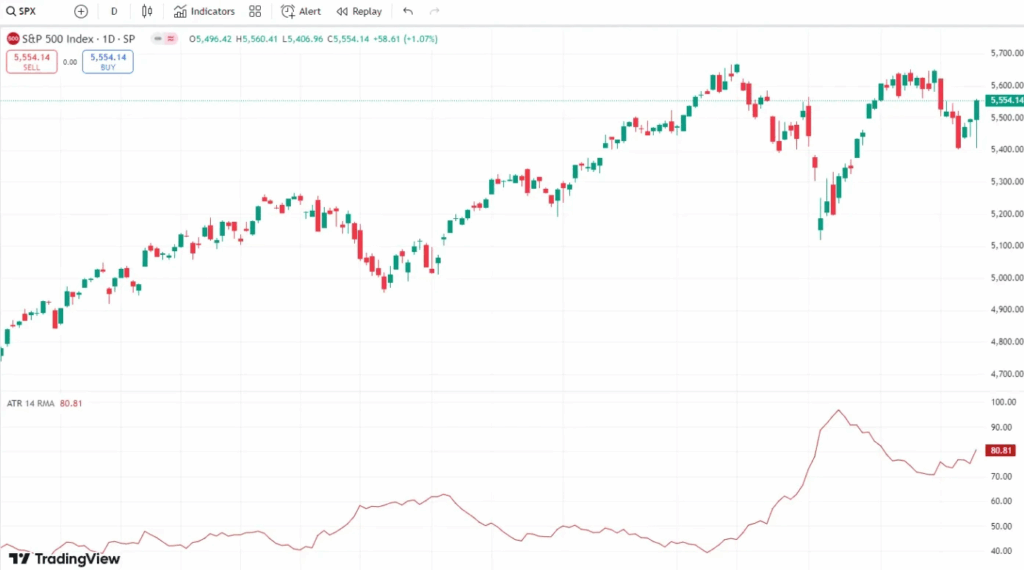
To gain direction, ATR should be incorporated with other trend-following indicators. ATR assists in trade management and decision making for risk a trader in the crypto and forex market.
Features Average True Range (ATR)
- Defines the level of volatility in the market.
- Higher movements in the price results in a higher ATR, and lower ATR denotes calm market.
- Assists in determining stop-loss and position size.
- Works well with trend-following indicators.
- Trade risk management is possible in both the short and long term.
11. Parabolic SAR
The Parabolic Stop and Reverse (SAR) indicator provides signals for trend reversals. It does so through a series of dots which show either a bear or bull market.
Encapsulation of the price indicates a bull market, while the free space of the price signals a bear market. The shift of the dots to the opposite signal indicates a trend reversal.

Parabolic SAR is recommended with other indicators to avoid false signals. It is one of the simpler indicators, and is therefore more user friendly for people in the crypto and forex market.
Features Parabolic SAR
- Dots appear above and below the price that indicate the trend direction.
- A switch in the dots indicates a potential trend reversal.
- Works best in trending market conditions.
- Clear signals for the exits and entries are provided.
- Moving averages can be used to increase the efficacy of the system.
12. Commodity Channel Index (CCI)
The CCI assesses how far an asset price moves from an average price and identifies periods of overbought and oversold situations.
It signals overbought market conditions when the CCI hits +100 and beyond and oversold conditions when the CCI drops below -100.
CCI is used to identify potential trend reversals, confirm breakout strength, and determine optimum entry points.

It becomes particularly handy in ranging markets and in the identification of cyclical market highs and lows.
While trend-following indicators improve the CCI’s predictive ability. CCI enabled forex and crypto traders improve their timing, minimize risk, and take advantage of short-term price movements.
Features Commodity Channel Index (CCI)
- Measures distance from the average price of an asset.
- Over 100 is considered overbought and below 100 is considered oversold.
- Identifies trend reversals and breakout strength.
- Useful in ranging markets for cyclical highs/lows.
- Improves timing for exits and entries.
13. Pivot Points
In trading, pivot points help identify potential support and resistance. They are calculated based on the previous periods high, low, and close price, and they give intraday traders levels to base their entry, exit, and stop loss in relation to recent market activity.
They are particularly popular in crypto and forex trading for evaluating market sentiment, and estimating potential price changes.
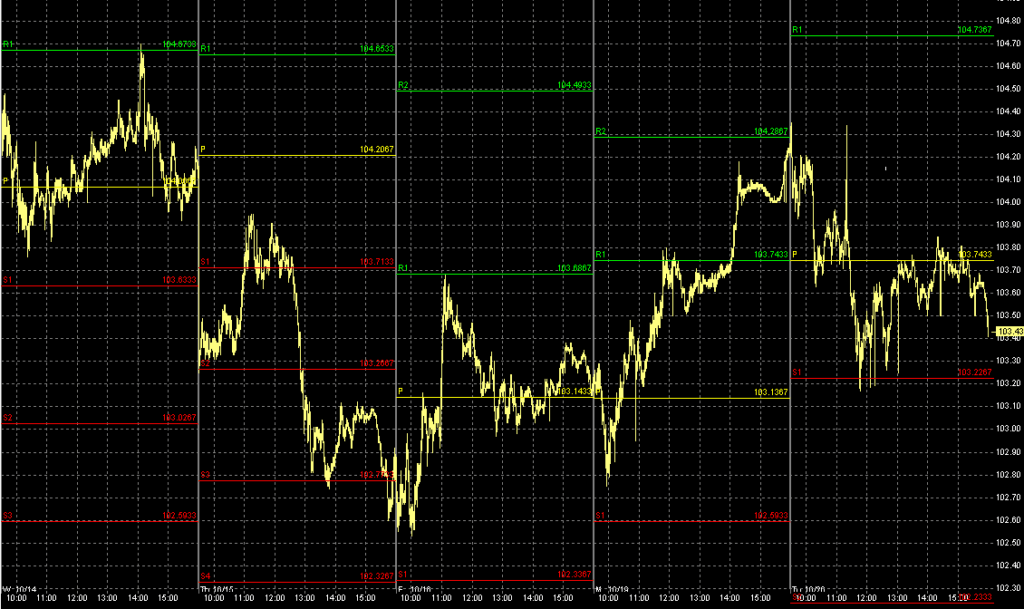
Pivot points are commonly used in conjunction with other indicators like RSI and MACD to confirm potential breakouts and reversals, and this increases the probability of a successful trade.
Features Pivot Points
- Calculates possible support/resistance levels from previous high, low, and close.
- Commonly used for intraday trading.
- Determines entry, exit, and stop-loss levels.
- Displays market sentiment and expected price reaction.
- Can be paired with trend indicators for confirmation.
14. ADX (Average Directional Index)
The Average Directional Index (ADX) assesses the strength of trends in the market without specifying the direction of the trend. An ADX value greater than 25 suggests a strong trend, whereas a value lower than 20 indicates a weak trend or a market in consolidation.
ADX assesses whether a trend-following strategy would be effective or whether a trader would be better served by range-bound strategies.
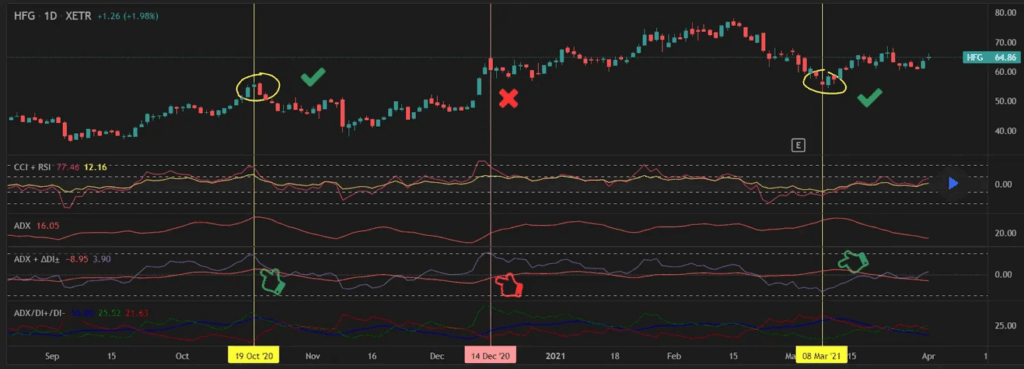
ADX is typically used in conjunction with the directional indicator lines +DI and -DI to assess bullish versus bearish trend dominance.
In forex and crypto markets, ADX is essential to evaluating the strength of a trend and avoiding low strength markets with low momentum and high risk.
Features Average Directional Index (ADX)
- Measures trend strength without considering direction.
- Over 25 suggests strong trend, under 20 shows weak trend.
- Aids in strategy selection (trend-following vs range-bound).
- Usually paired with +DI/-DI for bullish/bearish control.
- Avoids trading in dead/low momentum market.
15. Chaikin Money Flow (CMF)
The Chaikin Money Flow (CMF) indicator assesses price and volume over a specified time period to evaluate the magnitude of buying and selling pressure in a market.
When CMF is positive, it suggests the market is accumulating and bullish momentum is likely while negative CMF indicates distribution and bearish pressure.

CMF is used primarily to confirm price trends in conjunction with pattern analysis and divergence to predict reversals. In the highly volatile markets of crypto and forex,
CMF is critical in determining whether price movement is coupled with strong volume, enhancing the reliability of signals and decreasing the risk of trading during false breakouts.
Features Chaikin Money Flow (CMF)
- Analyzes price and volume for buying/selling pressure.
- Positive CMF shows bullish accumulation.
- CMF is Negative shows distribution and value decreases.
- Price trend is confirmed or trend reversal is signalled.
- Aids in identification of false breakouts and confirming trade signals.
Conclusion
In conclusion, mastering the key indicators and the associated trading strategies truly makes it easier for both crypto and forex traders to operate within a given set of market parameters.
The use of moving averages, RSI, MACD, and Bollinger Bands, among others, offers traders valuable information pertinent to the trends, momentums, and strengths of the market.
These indicators can be paired with disciplined risk management, which allows traders to remain rational and consistent, and identify high-probability situations for entry and exit points, thereby enhancing effectiveness in trading and achieving a smooth long-term strategy.
FAQ
What are technical indicators in trading?
Technical indicators are mathematical calculations based on price, volume, or open interest that help traders analyze market trends and make informed decisions.
Why are moving averages important?
They identify trend direction, smooth price fluctuations, and generate buy/sell signals through crossovers.
What does RSI indicate?
RSI shows overbought or oversold conditions and potential trend reversals.
How does MACD help traders?
MACD measures momentum and trend strength, providing crossover and divergence signals for trading opportunities.
What are Bollinger Bands used for?
They show volatility, identify overbought/oversold conditions, and signal potential breakouts during “squeeze” patterns.


