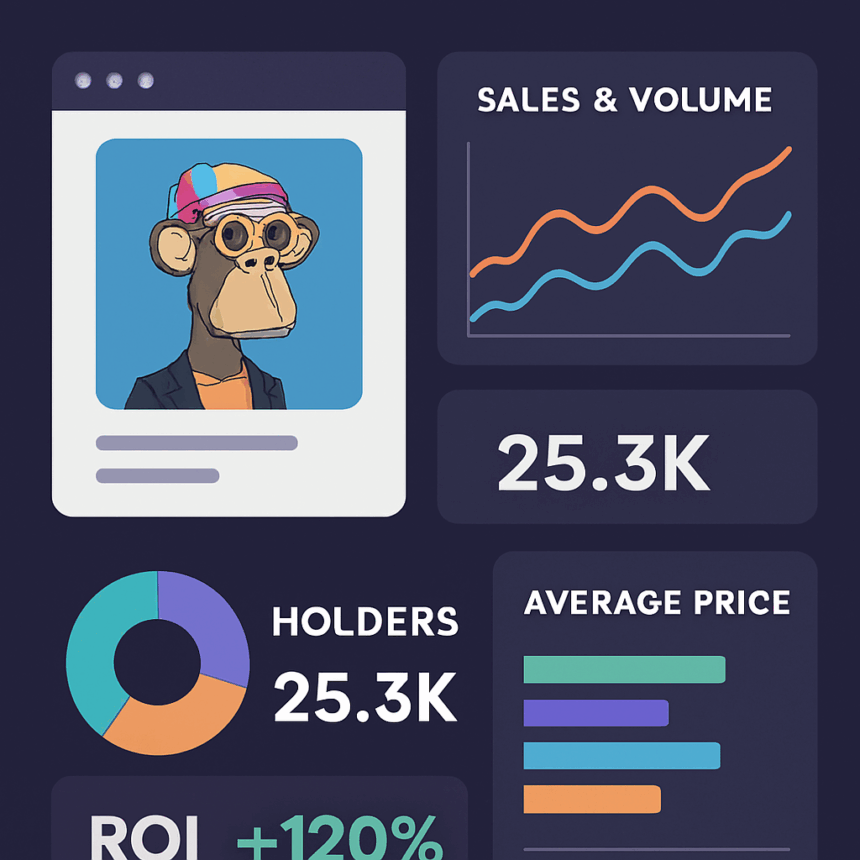
In this post, I will analyze Nft Performance Analytics For Brand Nft Campaigns, particularly focusing on brand influence over engagement, sales, ROI, and holder behavior regarding their digital collectibles.
Data-backed insights allow firms to improve their community engagement and targeting strategies, drops, and overall understand community dynamics on upcoming launches. It does not matter if it’s your first NFT or if you are scaling a series, achievement hinges on performing analytics.
Key Point & Nft Performance Analytics For Brand Nft Campaigns
| Metric | Key Point |
|---|---|
| Mint Volume | Measures total NFTs minted, indicating initial campaign uptake. |
| Unique Minters | Tracks distinct wallet addresses that minted, showing reach. |
| Chain Distribution | Analyzes mint activity across different blockchains used. |
| Floor Price Evolution | Monitors lowest sale price trend over time to gauge market sentiment. |
| Secondary Sales Volume | Captures resale activity and total trading value post-mint. |
| Holder Retention Rate | Percentage of holders keeping NFTs over a set period. |
| Top Holder Concentration | Shows share of supply held by largest wallets to assess decentralization. |
| Engagement-to-Mint Ratio | Compares social/media interactions to mints for campaign efficiency. |
| Royalties Earned | Total revenue from creator royalties in secondary sales. |
| Utility Activation Rate | Percentage of NFT holders redeeming brand-related perks or benefits. |
1️⃣ Mint Volume
Mint volume is the number of NFTs created as a result of a Brand’s campaign launch. It marks the first inflection point. It reflects how many users sought to engage and participate in the offering.
High mint volume is a good indicator of strong community either well advertised, well marketed, or well incentivized. It can also be indicative of hype or bottleneck.
Within NFT Performance Analytics for Brand NFT Campaigns, mint volume serves a foundational metric to gauge success and compare across drops. With this, the brand can determine if their launch strategy appealed to the users or if it needs refinement for future activations.
Mint Volume Features
- Measures total NFTs minted during campaign.
- Indicates initial traction and demand.
- Helps benchmark launch success.
- Reveals mint velocity and hype cycles.
- Useful for comparing across drops.
2️⃣ Unique Minters
Unique minters focus on the distinct wallet addresses that minted any NFTs during a given campaign. This indicator shows the scope of participation and centralization, whether the drop was dominated by a few whales across addresses, or embraced by a community.

A high unique minter count indicates strong reach and inclusivity, which is important for brand equity and long-term engagement. It also assists in identifying anomalies that may be the result of sybil attacks or bot-driven minting.
With respect to NFT Performance Analytics for Brand NFT Campaigns, tracking unique minters aids audience profiling and helps brands customize tailored engagement for future drops across different demographics and geographies.–
Unique Minters Features
- Counts distinct wallet addresses that minted.
- Highlights decentralization and reach.
- Detects bot activity or sybil attacks.
- Reflects organic vs. incentivized participation.
- Informs audience segmentation strategies.
3️⃣ Chain Distribution
Chain distribution looks at how the minting and trading of digital assets is spread over blockchains like Ethereum, Polygon, Solana, or Avalanche. For multi-chain campaigns, this metric reveals which ecosystems are most responsive to the brand’s offering.
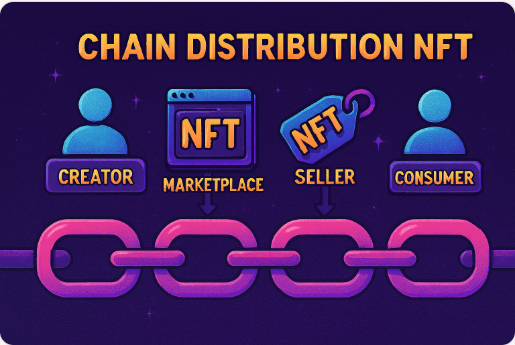
It also uncovers cost-efficiency patterns, such as the preference for utility NFTs on low-gas chains. Grasping chain distribution in the context of NFT Performance Analytics for Brand NFT Campaigns enables optimized future launches by selecting chains that fit the audience’s behavior, technical inclinations, and wallet compatibility.
It is also essential for cross-chain interoperability planning, particularly for integrating NFTs into loyalty programs, metaverse assets, or other gamified elements.
Chain Distribution Features
- Tracks activity across multiple blockchains.
- Reveals user preference for specific ecosystems.
- Affects gas costs and UX.
- Informs future chain selection.
- Supports cross-chain interoperability planning.
4️⃣ The Evolution of Floor Prices
The evolution of floor prices monitors the lowest price tier at which NFTs are offered for sale as it changes through time, which reflects the market’s point of view at the moment. Increasing floor prices indicate higher demand and value perception, successful utility realization, or demand perception.
On the other hand, declining floor prices suggest lack of interest and oversupply. Marketers also connect floor price changes to campaign milestones—such as influencer promotions or perk unlocks.
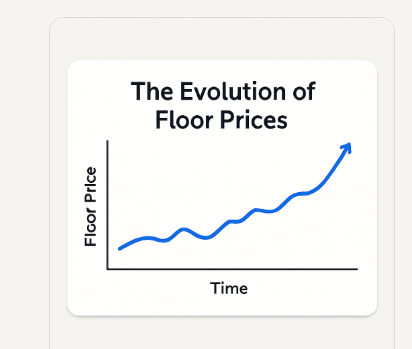
For the purposes of NFT Performance Analytics for Brand NFT Campaigns, this indicator helps evaluate the brand’s value in the market in comparison to other assets after the launch of the campaign.
Additionally, it serves as a critical indicator for the state of the community, since stable or increasing floor prices suggest that confidence in long-term value among the holders is high.
Floor Price Evolution Features
- Monitors lowest listing price over time.
- Reflects market sentiment and perceived value.
- Correlates with campaign milestones.
- Indicates holder confidence or exit pressure.
- Useful for trend analysis and timing perks.
5️⃣ Secondary Sales Volume
The secondary sales volume tracks how NFTs are traded across different marketplaces after the initial minting. It indicates liquidity, collector interest, and the staying power of a campaign.
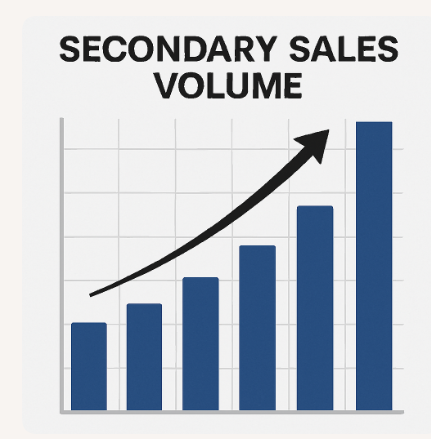
High volume indicates active demand for the NFTs, while low volume may indicate limited demand, findability issues, or weak marketing. This metric helps brands evaluate the performance of their NFTs, and whether more marketing or utility is warranted.
Within the scope of NFT Performance Analytics for Brand NFT Campaigns, secondary sales volume is crucial for the analysis of post-mint interaction and evaluating the impact of community engagement initiatives after the initial drop.
Secondary Sales Volume Features
- Measures post-mint trading activity.
- Indicates liquidity and collector interest.
- Highlights campaign longevity.
- Helps evaluate performance in the market
- Displays the necessity for engagement after launch
6️⃣ Holder Retention Rate
Holder Retention Rate (HRR) measures the proportion of wallets that continue to hold their NFTs after a defined interval (7, 30, or 90 days). It is a significant measure of loyalty, brand affinity, and engagement over time.
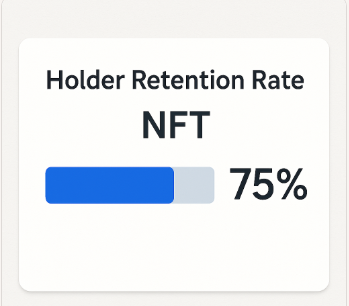
High retention is likely tied to utility, emotional attachment, or speculation around the NFT. Low retention might indicate speculative trading, lack of engagement after minting, or insufficient post-mint incentives.
Within the scope of NFT Performance Analytics for Brand NFT Campaigns, this metric assists brands in assessing whether their NFTs are regarded as collectibles, access tokens, or tradeable assets. It also guides the brand in developing retention-focused incentives, staking, and gamification.
Holder Retention Rate Features
- Monitors how long wallets retain the NFTs
- Indicates loyalty to the brand and the utility value
- Distinguishes between flippers, long-term holders
- Guides the formation of staking or reward plans
- Helps in the analysis of community wellbeing
7️⃣ Top Holder Concentration
Top holder concentration indicates how much of the supply of NFTs is possessed by the largest wallets, which is usually the top 10 or 20 wallets. If there is a high concentration, this might mean whale dominance, which can be a risk for price stability and governance of the community.
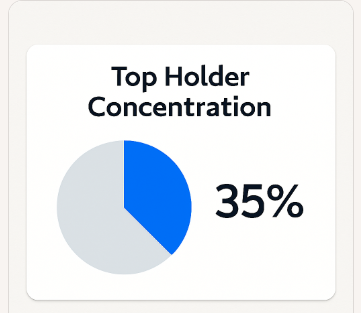
On the other hand, a holder base that is more distributed indicates a healthier form of decentralization and grassroots support. Brands need to pay attention to this in order to protect themselves from manipulation or abrupt sell-off.
Within the scope of NFT Performance Analytics for Brand NFT Campaigns, top holder concentration is important in evaluating the NFT ecosystem’s resilience and in ensuring that the campaign’s success does not rely excessively on a handful of influencers. It also helps determine future whitelist or airdrop strategies.
Top Holder Concentration Features
- Displays the proportion of NFTs held by the largest wallets
- Determines the concentration of whale dominance or decentralization
- Influences price stability and governance risk
- Provides information for whitelist and airdrop strategy
- Aids in assessing ecosystem resilience
8️⃣ Engagement-to-Mint Ratio
The engagement-to-mint ratio measures social media interaction (likes, shares, and comments) and campaign reach in relation to the NFTs minted. It is a form of conversion measurement that highlights the effectiveness of hype.
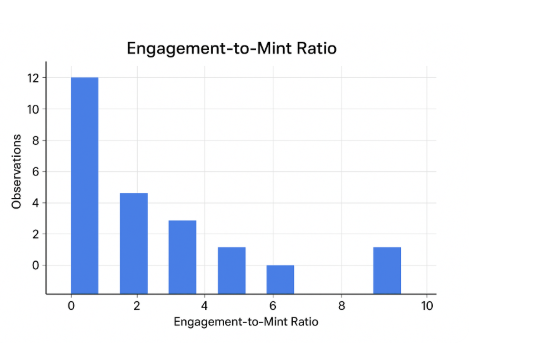
A high ratio indicates a successful campaign whereas a low ratio indicates a struggle to connect messaging and product appeal. Brands may refine their targeting, content formats, or influencer collaborations.
This ratio as part of NFT Performance Analytics for Brand NFT Campaigns provides a quantitative marketing to blockchain impact analysis, ensuring engagement is not merely digital participation in the form of buzz, but meaningful action.
Engagement-to-Mint Ratio Feratures
- Relates social activity to the actual minting of NFTs based on a timeframe
- Evaluates the effectiveness of a campaign
- Draws attention to kinks in the messaging flow
- Provides strategic direction for content influencers as well as marketing
9️⃣ Royalties Earned
Royalties earned are the income received from sales in the secondary market, often defined as a percentage of each sale. This metric indicates the campaign’s long-term monetization potential and the revenue sustainability of the creator or brand.
It also encourages the brand to foster ongoing community engagement and the development of utility. Within NFT Performance Analytics for Brand NFT Campaigns, royalties earned aid in assessing the campaign’s financial impact beyond the initial mint, helping track the campaign’s long-term value.
Royalties also assist in determining pricing, royalty allocations, and which marketplaces to list to optimize collection value while keeping the collectors satisfied.
Royalties Earned Features
- Monitors passive income earned from secondary sales activity
- Indicates Monetization potential in the long term
- Motivates for brand engagement in the long term
- Provides information on how to split royalties and model pricing
- Useful in the analysis of brand sustainability
🔟 Utility Activation Rate
As an example, event access, discounts, exclusive content, or even gamified experiences can all be unlocked through the use of NFTs. Utility Activation Rate measures how many NFTs have been used to unlock these perks.
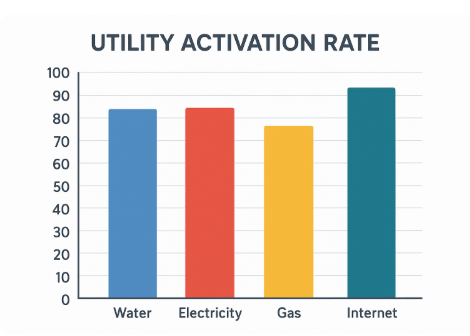
It is the most accurate indicator of value and user engagement. With a high activation rate, it means holders are using these NFTs to engage with the brand, which is a good sign. A low activation rate would be an indicator of poor utility value or poor user experience.
Within NFT Performance Analytics for Brand NFT Campaigns, this metric is vital for determining how well the NFT is designed and integrated into the brand ecosystems. It also aids in utility planning and in justifying long-term strategies aimed at sustaining the NFTs to stakeholders.
Utility Activation Rate Features
- Monitors the number of NFTs that activate the various perks
- Indicates the value as well as the use in the real world
- Draws attention to effectiveness in user experience
- Guides the design of future utility to be created
- Confirms the integration of NFTs into the brand ecosystem
Conclusion
Analytics on NFT performance are imperative for brands especially when dealing with digital assets. Every metric such as mint volume, unique minters, utility activation or royalties earned paints a picture of audience engagement, campaign effectiveness, and brand equity over time.
With real engagement metrics available, teams can anchor their decisions on engagement, retention and value rather than hype and speculation, especially with earned value.
Brands can now track floor price evolution and recalibrate their strategies as needed. Loyalty is earned as is attention. Performance analytics are the compass brands need for executing successful NFT campaigns.
FAQ
Why are NFT performance analytics important for brands?
They help brands measure campaign success, understand user behavior, and optimize future drops. Analytics turn hype into actionable insights—tracking engagement, retention, and monetization.
What’s the difference between mint volume and unique minters?
Mint volume counts total NFTs created, while unique minters track how many distinct wallets participated. Together, they reveal scale and decentralization of the campaign.
How does chain distribution impact campaign strategy?
It shows which blockchains users prefer, affecting gas fees, UX, and reach. Brands can use this to choose chains that align with audience behavior and technical needs.
What does floor price evolution tell us?
It reflects market sentiment over time. Rising floors suggest growing demand or utility activation; falling floors may signal oversupply or lack of engagement.
Why track secondary sales volume?
It indicates post-mint interest and liquidity. High volume means active trading and sustained relevance; low volume may require re-engagement strategies


