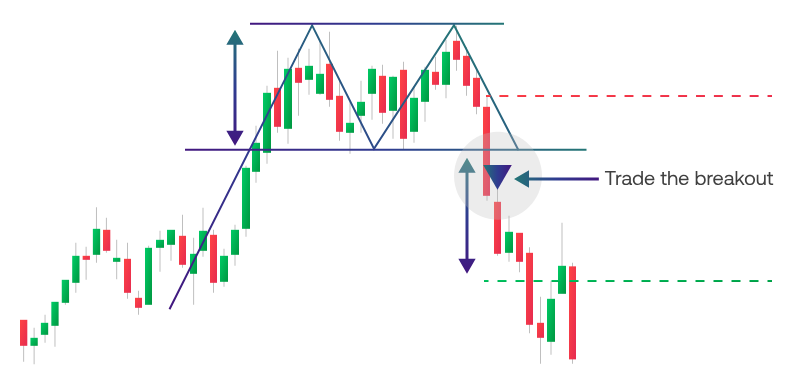
In this article, I outline some chart patterns that every cryptocurrency and forex trader must know. They are critical for examining and forecasting market trends and price fluctuations.
Analyzing these patterns will assist traders in decision-making and risk management concerning market opportunities for cryptocurrency and forex. These include reversal patterns like the Head and Shoulders and continuation patterns such as the Triangles and Flags.
Key Point & Chart Patterns Every Crypto and Forex Trader Should Recognize
| Pattern | Key Points |
|---|---|
| Head and Shoulders | Indicates trend reversal from bullish to bearish; consists of left shoulder, head, and right shoulder; confirms after breaking the neckline. |
| Inverse Head and Shoulders | Signals trend reversal from bearish to bullish; mirrored version of Head and Shoulders; breakout above neckline confirms upward move. |
| Double Top | Bearish reversal pattern after an uptrend; two peaks at similar levels; breakdown below support confirms trend reversal. |
| Double Bottom | Bullish reversal pattern after a downtrend; two troughs at similar levels; breakout above resistance confirms upward trend. |
| Ascending Triangle | Bullish continuation pattern; horizontal resistance with rising lows; breakout above resistance indicates upward trend. |
| Descending Triangle | Bearish continuation pattern; horizontal support with falling highs; breakdown below support indicates downward trend. |
| Symmetrical Triangle | Neutral pattern; converging trendlines with lower highs and higher lows; breakout direction determines trend continuation. |
| Bullish Flag | Short-term consolidation during an uptrend; rectangular shape sloping downward; breakout upward signals trend continuation. |
| Bearish Pennant | Short-term consolidation during a downtrend; small symmetrical triangle; breakdown downward signals trend continuation. |
| Rising Wedge | Bearish reversal pattern; upward sloping converging trendlines; breakdown below support indicates trend reversal. |
| Falling Wedge | Bullish reversal pattern; downward sloping converging trendlines; breakout above resistance indicates trend reversal. |
| Rectangle Pattern | Continuation pattern; price moves between parallel support and resistance; breakout direction determines next trend. |
| Cup and Handle | Bullish continuation pattern; rounded “cup” followed by a small consolidation “handle”; breakout above handle signals upward move. |
1. Head and Shoulders
The Head and Shoulders pattern is one of the most reliable trend reversal indicators as it signifies a market transition from bullish to bearish.

It illustrates a series of three peaks consisting of the left shoulder, a higher head, and the right shoulder, which are all joined together by a neckline. A confirmation of the reversal is determined when a trader breaks below the neckline.
This pattern is instrumental in cutting losses and serves as an ideal entry point to initiate a short position. It’s considered one of the most important Chart Patterns Every Crypto and Forex Trader Should Recognize.
Head and Shoulders Features
- Trend Reversal Signal: Alerts a trader to a possible change from bullish to bearish trend.
- Three Peaks Structure: A trader should identify the left shoulder, higher head, and the right shoulder of similar height to complete this setup.
- Neckline Break: Traders will be alerted to a trend change when the price breaks below the neckline support.
2. Inverse Head and Shoulders
The Inverse Head and Shoulders is the bullish counterpart of the Head and Shoulders pattern, indicating the pattern is heading for a reversal from a downtrend to an uptrend. In this case, the market trend has a central low, the head, and is flanked by two higher lows, the shoulders.

When the price breaks above the neckline, the pattern is confirmed, and a solid entry for long positions is provided.
It is important to learn this pattern to catch the beginning of the upward momentum early. This is a fundamental Chart Pattern Every Crypto and Forex Trader Should Recognize and should learn to take advantage of trend reversals in the market for both crypto and forex.
Inverse Head and Shoulders Features
- Trend Reversal Signal: Indicates that the bearish trend will reverse to a bullish trend.
- Three Troughs Structure: The middle trough (head) must be lower than the two shoulders.
- Neckline Breakout: A price crossing above the neckline will confirm the bullish trend.
3. Double Top
The Double Top pattern is a classic bearish reversal signal that comes after a strong uptrend. It is formed when the price reaches a peak, then pulls back and retests the peak again before failing.

When this occurs, traders can take advantage of a break in the support level, thereby confirming the pattern and reversing the trend. This pattern is best used to identify exit points for long trades or to enter short positions.
Understanding this signal is vital within Chart Patterns Every Crypto and Forex Trader Should Recognize and in losing crypto and forex and to avoid losing money during a downtrend.
Double Top Features
- Bearish Reversal: This pattern occurs after an uptrend and signals that the market will decline.
- Two Peaks Formation: The price must reach two similar high points, and a moderate trough must be present in between.
- Support Break: The price must drop below the support level to confirm this pattern.
4. Double Bottom
Double Bottoms are specifically characterized as Bullish Reversal Patterns. Coming straight after a downtrend, a Double Bottom consists of two roughly equivalent lows with a peak in between. By simply scanning a market, a trader will know that bullish momentum is coming only by a break above the resistance level.

This market pattern is widely traded as it means market rebounds and traders can commence long market orders.
This market pattern also signals traders that the downtrend is coming to an end and the market is starting to move in a bullish trend, making it one of the most essential chart patterns every crypto and forex trader should recognize.
Double Bottom Features
- Bullish Reversal: This pattern occurs after a downtrend, indicating the price will move upward.
- Two Lows Formation: The price will reach two similar low points, and a small peak must be present in between.
- Resistance Breakout: A breakout above the peak that is between the two lows will confirm the reversal.
5. Ascending Triangle
The Ascending Triangle is a Bullish Continuation Pattern. As described, it has a flat resistance line with a rising support line. This means that buyers are most accruably ‘pushing the price higher’ and creating higher lows, while sellers are holding a fixed resistance.

Most noted, an ascending triangle pattern is recognized in an uptrending market where a break above the resistance is noted.
This pattern is important in trading because it gives a trader the upmost confidence to take a long position on the market, ultimately sustaining the goal of increasing price. Recognizing an ascending triangle is vital because it is one of the most essential chart patterns every crypto and forex trader should recognize.
Ascending Triangle Features
- Bullish Continuation: This is most likely to happen when the market is bullish.
- Flat Resistance & Rising Support: The price is making higher lows while facing a flat horizontal triangle.
- Breakout Signal: The price opens above the resistance line.
6. Descending Triangle
A Descending Triangle is a bearish continuation pattern because it consists of a flat support line and a descending resistance line. With the formation of lower highs to the resistance, sellers are pressuring the buyers to maintain support. A break below the support line confirms the continuation of the downtrend.

This pattern is used by traders to identify breakout points to enter short positions. Among the Chart Patterns Every Crypto and Forex Trader Should Recognize, the Descending Triangle is used to predict bearish market momentum in the crypto and forex markets.
Descending Triangle Features
- Bearish Continuation: This is most likely to happen when the market is bearish.
- Flat Support & Falling Resistance: The price is making lower highs while descending upon flat horizontal support.
- Breakout Signal: The price breaks the support line.
7. Symmetrical Triangle
A Symmetrical Triangle is a neutral pattern in which converging trendlines are formed by lower highs and higher lows. It signifies consolidation, as the market is equilibrated and the buyers and sellers are uncertain.

The breakout direction will lead the market in a new trend. This pattern is also important in the Chart Patterns Every Crypto and Forex Trader Should Recognize because it allows traders to trade breakouts in either direction in the crypto and forex markets.
Symmetrical Triangle Features
- Neutral Pattern: This formation can suggest trend continuation and trend reversal, so the pattern is neutral.
- Converging Trendlines: The price is making lower highs and higher lows.
- Breakout Direction: The breakout is likely to happen in the same direction as the trend.
8. Bullish Flag
The Bullish Flag is a short-term continuation pattern seen during strong uptrends. It appears as a small downward-sloping rectangle, representing consolidation before the trend continues. Traders watch for a break above the flag to confirm continuation, providing ideal long entry points.
Understanding this pattern helps traders maintain positions during minor pullbacks without panic selling. This is one of the essential Chart Patterns Every Crypto and Forex Trader Should Recognize, especially for capturing profits in trending markets.
Bullish Flag Features
- Trend Continuation: This formation happens after a strong bullish trend and signals trend continuation.
- Small Consolidation: The price consolidates in a small parallel channel.
- Breakout Upwards: This breakout signals continuation of the bullish trend when the price breaks above the flag.
9. Bearish Pennant
The Bearish Pennant is a continuation pattern that forms during a downtrend, featuring a small symmetrical triangle after a sharp decline. It represents a brief consolidation before the downtrend resumes.

Traders anticipate a break below the pennant for potential shorting opportunities. Spotting this pattern helps avoid mistaking minor corrections for trend reversals. It is among the key Chart Patterns Every Crypto and Forex Trader Should Recognize, aiding in timing short trades in crypto and forex markets.
Bearish Pennant Features
- Trend Continuation: This formation occurs after a strong bearish trend.
- Small Converging Triangle: The price consolidates in a small symmetrical triangle.
- Breakout Downwards: This breakout confirms the continuation of the bearish trend.
10. Rising Wedge
The Rising Wedge is a bearish reversal pattern. It consists of upward-sloping converging trendlines. This means it consists of upward-sloping converging trendlines. It directly indicates a potential trend reversal.

A screen of a break below the lower trendline indicates bearish price action. These traders will then close their long positions and open a short. This is one of the most important patterns. This is the chart patterns every crypto and forex trader should recognize. This is a great pattern to locate market corrections after extended uptrends.
Rising Wedge Features
- Bearish Reversal: This pattern can suggest a reversal, specifically the formation of a bearish trend while the pattern is rising in an uptrend.
- Converging Upward Trendlines: Price continues making higher highs and higher lows which converge.
- Breakdown Signal: A decline is indicated when price breaks down through the lower trendline.
11. Falling Wedge
The Falling Wedge is a bullish reversal pattern. It consists of downward-sloping converging trendlines. In the market the prices are falling, but momentum is slowing. This indicates a possible upcoming breakout.
A screen of a break above the upper trendline will have traders to open bullish bets. This is the motive ammunition The Falling Wedge is a very important altering pattern, it is one of the chart patterns every crypto and forex trader should recognize. This pattern will help traders know the prime reversal points after a market decline.
Falling Wedge Features
- Bullish Reversal: This pattern typically appears in a downtrend and indicates the price will break up.
- Converging Downward Trendlines: Downward trendlines converge when lower highs and lower lows are formed.
- Breakout Upwards: A bullish reversal is indicated when price breaks the upper trendline.
12. Rectangle Pattern
Rectangle Patterns are continuation patterns which occur when the price moves sideways and horizontally between support and resistance levels. This pattern represents price consolidation and the potential for breakouts in either direction.

Breakouts in the upper levels signify the possibility of price increasing further, while breaches of the lower levels distinguish price dropping further.
Knowing how to identify this pattern is critical for assessing potential risks given its importance in the Chart Patterns Every Crypto and Forex Trader Should Recognize series, as it depicts the market indecision and the price movement to follow.
Rectangle Pattern Features
- Consolidation Zone: Price action moving sideways signifies a period of consolidation.
- Parallel Trendlines: A defined rectangle is created when horizontal highs and lows are defined.
- Breakout Direction: Price can break in either direction and will indicate the future direction of the trend.
13. Cup and Handle
The Cup and Handle is a bullish continuation pattern when the price finishes forming the rounded “cup” and the small consolidation “handle” right after. It indicates a short period of consolidation and the price is about to continue its upward move.

The traders spot a consolidation pattern and expect a break above the handle which is a strong signal for a continuation of the bullish trend.
This pattern is perfect for buyers to enter and capture prices after minor retracements. It is one of the most important to recognize in Chart Patterns Every Crypto and Forex Trader Should Recognize, as the crypto and forex markets tend to repeat classic technical patterns.
Cup and Handle Features
- Bullish Continuation: This pattern indicates the price will continue moving up after a bullish trend.
- Cup Formation: A rounded bottom is formed, taking a “U” shape.
- Handle Formation & Breakout: A consolidation pattern prior to a breakout will form the handle and indicate to traders a price increase is coming.
Conclusion
Identifying and understanding important chart patterns are vital for all crypto and forex traders. Some of the patterns include Head and Shoulders, Double Tops and Bottoms, Triangles, Flags and Wedges. These patterns show traders different opportunities concerning trend reversals, trend continuations, and possible breakouts.
Knowing these patterns allow traders to pinpoint entry and exit points, assess risk potential, and improve profit margins within the highly volatile crypto markets and relatively stable forex markets. Regularly employing these patterns within the context of technical analysis enables traders to improve their trading outcome as they tactically gain the desired edge within a specific trading period.
FAQ
Why are chart patterns important for crypto and forex trading?
Chart patterns provide insights into market psychology and trend momentum. They help traders identify entry and exit points, manage risk, and make more informed decisions in volatile crypto markets and liquid forex markets.
Which are the most common chart patterns?
Some key patterns include Head and Shoulders, Inverse Head and Shoulders, Double Top, Double Bottom, Triangles (Ascending, Descending, Symmetrical), Flags, Pennants, Wedges, Rectangle, and Cup and Handle.
Can chart patterns guarantee profits?
No pattern guarantees profits. They indicate potential market behavior but should be used with proper risk management and trading strategies. They increase the probability of successful trades rather than ensure certainty.
Are chart patterns the same for crypto and forex?
Yes, the patterns work in both markets because they reflect trader psychology. However, crypto is more volatile, so breakouts can be sharper and faster than in forex.


