

Ethereum Price Prediction: Will ETH Crash to $1,760 in November 2026?
Ethereum price stayed under pressure on Saturday, trading around $1,898 after dropping below the psychological $1,900 level amid a wider selloff in the cryptocurrency market. Ether fell 1.96% in the last 24 hours and the total crypto market capitalization dropped 2.36% to $2.26 trillion.
Sentiment across markets was fragile as investors digested new inflation data, expectations on Federal Reserve interest rate moves and a growing number of liquidations across leveraged positions. Meanwhile, traders on Kalshi anticipated Ethereum could fall to a November low of $1,760, increasing fears of more downside risks.
With more than two weeks left in November, traders are closely watching ETF flows, institutional holdings and technical indicators for signs of a possible recovery or deeper correction.
Kalshi Traders Expect Ethereum to Fall to $1,760 in November
Kalshi market predictions show increasing expectations of more weakness in Ethereum’s price in November 2026. The platform’s projected November low came in several sharp moves, with a total decline of around $351. The most recent prediction had put ETH’s potential fall to $1,760, which would have been a 7.5% drop from its $1,898 trading price on Saturday.

Forecasts indicate rising caution among prediction market participants amid ongoing cryptocurrency volatility. With just over two weeks left in November, Ethereum is under pressure as market sentiment weakens and institutional investment worries continue.
Meanwhile, blockchain data showed a newly funded wallet received approximately $2 million in Ether from Gate in four separate withdrawals over an hour. The latest transaction accounted for some $698,000, or more than a third of the total amount transferred.
There are also worries about institutional exposure Bitmine Immersion Technologies had an estimated $8.6 billion in unrealized losses on its Ethereum holdings. Its Ether holdings were down about 43.11% from the price the firm paid to acquire them, highlighting the financial strain from falling cryptocurrency prices.
Ethereum Price Drops Below $1,900 as Inflation Rises and Liquidations Increase
Ethereum fell under $1,900 as uncertainty rippled across financial markets. Recent inflation prints bolstered expectations that the Fed could keep rates high or consider additional monetary tightening. Higher interest rates usually dampen demand for riskier assets such as cryptocurrencies.
Bitcoin faced some selling pressure too, trading around $67,331 after trading below $67,000 for the first time. The price continued to trade below the $68,500–$69,000 support zone, with another possible downside level appearing around $65,000.
The market plunge was deepened by liquidations. Roughly $240 million in crypto positions were liquidated in just 20 minutes. “The total forced closures in 24 hours were 126,493 traders, which is about $672.39 million.
The largest single liquidation was for an Ether position worth $17.81 million, with Binance taking the record. Investors are now looking to the Federal Reserve’s policy meeting of December 8-9 for more clarity on the direction of interest rates.
Ethereum ETF Experiences $2.36M Inflows Amidst Bitcoin Fund Outflows
Institutional investment flows painted a mixed picture for the cryptocurrency market. Market data showed U.S. spot Ethereum ETFs attracted net inflows of $2.36 million on Nov. 13.
Fidelity’s FETH took in $11.64 million while Grayscale’s Ethereum Mini Trust ETF saw outflows of $9.28 million. Friday’s gain was encouraging, but Ethereum ETFs experienced net outflows of around $398.9 million over the last five trading days.
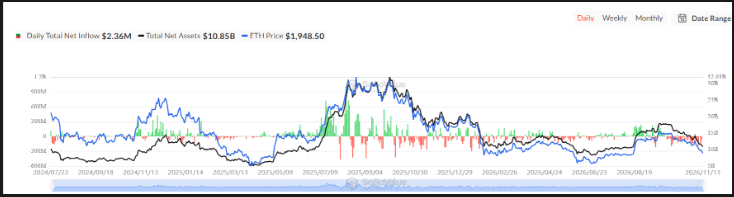
Bitcoin investment products saw further pressure with $185 million worth of net outflows on Nov. 13. This was their seventh straight session of outflows. BlackRock’s IBIT accounted for $144 million while Fidelity’s FBTC recorded outflows of $41.92 million.
The figures indicate that institutional demand is still cautious, although some positive inflows are going into Ethereum investment products.
Ethereum Price Analysis: RSI and MACD indicate bearish momentum
ETH is trading within a falling price channel and bearish signals continue to emerge on Ethereum’s four-hour price chart. The cryptocurrency recently traded at around $1,898.57 and was below its seven-day and 30-day moving averages, suggesting continued selling pressure.
The Relative Strength Index (RSI) was 29.84, just below the traditional oversold level of 30. This means selling pressure has increased although an oversold reading does not indicate a quick price rebound.
The Moving Average Convergence Divergence (MACD) indicator was also bearish. Its MACD line was -57.98 while the signal line was at -53.67. However, the histogram narrowed to -4.31, suggesting bearish momentum had eased slightly over the latest candles.
Is Ethereum Price Going to $1,760 in November 2026?
The near-term price direction for Ethereum hinges on whether buyers can hold the $1,900 level and avoid another breakdown. A sustained move below this level could open up ETH to support near $1,800. If the selling pressure continues, Kalshi’s expected November low of $1,760 could be an important downside level to watch.
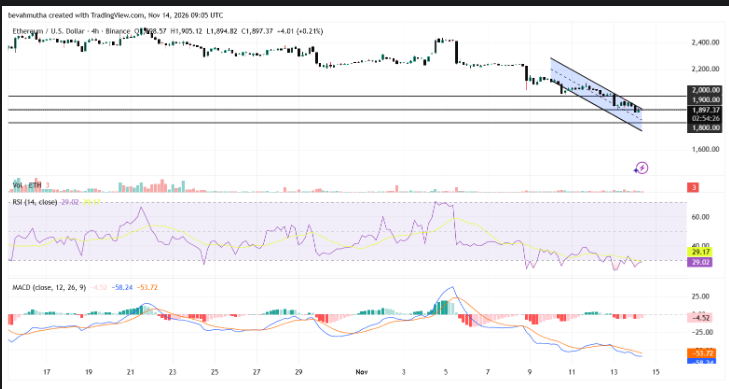
On the upside, a break above the upper boundary of the descending channel may improve short-term sentiment and bring the $2,000 resistance level back into play.
Ethereum is facing several problems at the moment, including institutional outflows, leveraged liquidations, inflation uncertainty and weak technical momentum. Kalshi’s $1,760 projection is a market expectation and not a guarantyd price target. Traders will likely watch ETF inflows, Fed signals, and key support levels before deciding whether Ethereum can bounce back or slide further.