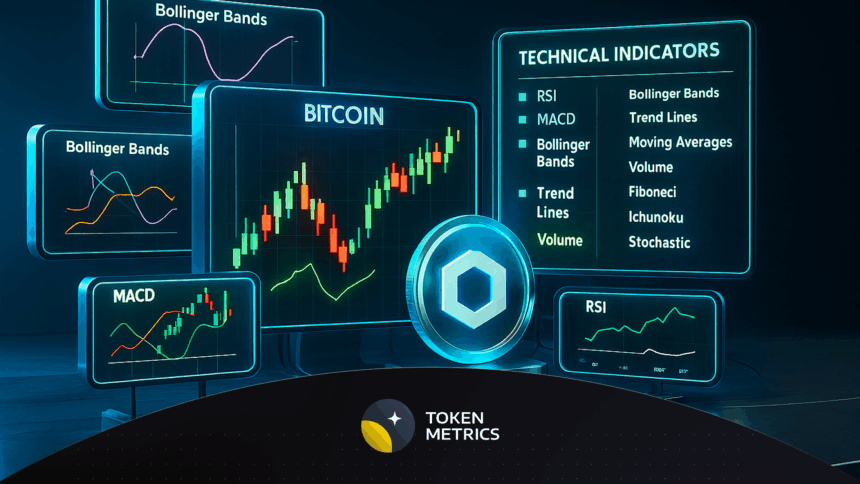
This article will focus on the Technical Analysis Tools That Work for Both Crypto and Forex. Assessing market tendencies, pinpointing probable entry and exit points, and determining risks can all be effectively managed with the right tools.
Tools including TradingView, the MT4 and MT5 platforms and indicators such as the Fibonacci retracement and Bollinger Bands, as well as candlestick shapes, all make it possible to work between crypto and forex markets efficiently.
Key Point & Technical Analysis Tools That Work for Both Crypto and Forex List
| Tool / Indicator | Key Points |
|---|---|
| TradingView | Advanced charting platform, customizable indicators, social trading ideas. |
| MetaTrader 4/5 (MT4/MT5) | Popular trading platform, automated trading via Expert Advisors, multi-asset support. |
| Fibonacci Retracement | Identifies potential support/resistance levels, helps spot trend reversals, widely used in technical analysis. |
| Bollinger Bands | Measures volatility, highlights overbought/oversold conditions, helps identify breakout points. |
| Moving Averages (SMA/EMA) | Smooths price data, identifies trend direction, EMA reacts faster to recent price changes. |
| Ichimoku Cloud | Provides trend direction, support/resistance, and momentum in one view, offers predictive signals. |
| Stochastic Oscillator | Indicates overbought/oversold levels, signals potential trend reversals, works well in ranging markets. |
| Support & Resistance Zones | Highlights key price levels, helps determine entry/exit points, critical for trend analysis. |
| Candlestick Patterns | Visualizes price action, identifies reversal or continuation signals, forms basis of technical analysis. |
| Trendlines & Channels | Defines trend direction, identifies breakout/bounce points, useful for pattern recognition. |
1. TradingView
View is the best charting platform available for the crypto and forex markets. It features interactive charts, 100 plus technical indicators, and technical analysis tools. It allows for customizing indicators, creating alerts, and automating trading strategies using Pine Script.
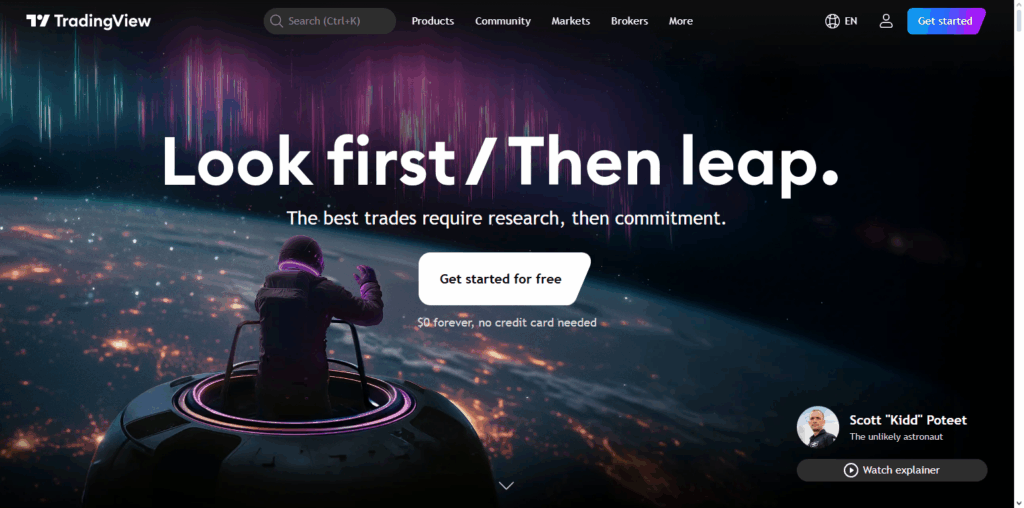
The social community is user and analysis sharing friendly. It combines educational and collaborative features. The platform’s center facilitates the overlaying of indicators on the user’s chart. The most useful indicators in real time are the moving averages and Bollinger Bands, aiding decision making in trading sessions for various instruments in the market.
TradingView Features
- Advanced Charting: Provides interactive charts with a plethora of more than 100 technical indicators and drawing tools to analyze price action.
- Customizable Alerts: Alerts can be set by traders on price levels, indicator values, and trendline breaks and can be notified in real-time.
- Community & Scripts: A community to share valuable information with a social network and access to Pine Script for custom indicators and automated strategies.
2. MetaTrader 4/5 (MT4/MT5)
MetaTrader 4 and 5 are some of the various platforms that allow users to trade cryptocurrencies and foreign exchange. They offer users advanced tools for charting, the ability to trade using automated strategies through the Expert Advisors, and tools for comprehensive backtesting.
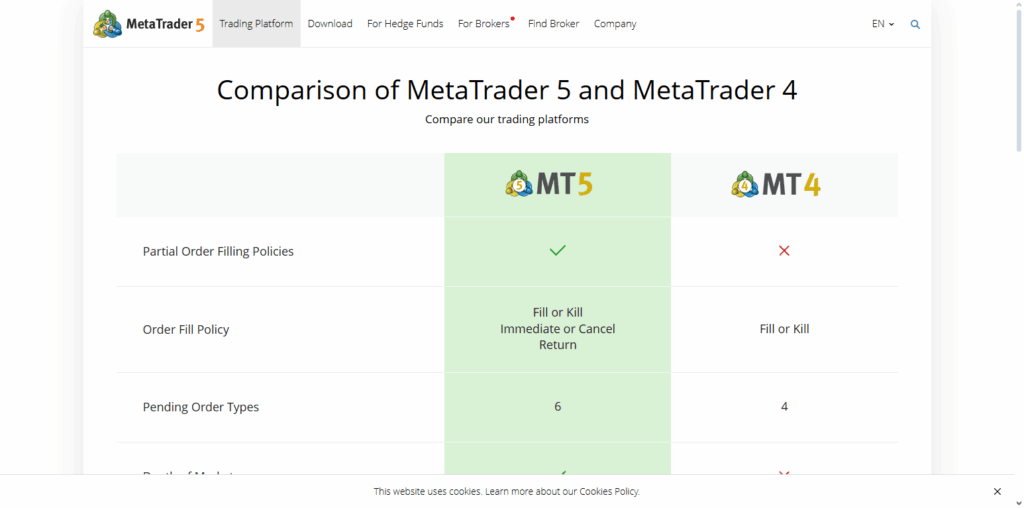
While MT4 is designed for users who prefer the straightforward approach, MT5 caters to more complex users as it offers more trading pairs, more trading calendars, and more time-frames. In the center of the screen, users have the ability to track various indicators like Fibonacci retracements and stochastic oscillators.
These platforms allow automated trading strategies which provide the users the ability to integrate trading automation in the volatile market for foreign exchange and cryptocurrencies thereby improving consistency, discipline, and precision in order execution.
MetaTrader 4/5 (MT4/MT5) Features
- Algorithmic Trading: Automated strategies for crypto and forex can be done and backtested through Expert Advisors (EAs).
- Multi-Asset Support: MT5 provides more assets to work with and offers more timeframes, integrated economic calendars for versatile market analysis.
- Advanced Tools: One-click trading, built-in indicators, and customizable charts are provided to enhance efficiency.
3. Fibonacci Retracement
Fibonacci retracement identifies potential reversal levels when a market is trending. As a tool goes beyond Fibonacci sequences, retracement levels at 38.2%, 50%, and 61.8% become significant support and resistance levels.

In crypto and forex trading, Fibonacci levels can be used to identify price pullbacks that occur between significant highs and lows. This tool integrates well with candlestick patterns or trendlines correcting patterns.
The main advantage of using Fibonacci retracement is identifying price corrections and continuation points, giving traders greater precision on when to open and close trades and where to set and adjust stop-loss levels.
Fibonacci Retracement Features
- Trend Prediction: Determines potential reversal points in trending markets with key Fibonacci ratios of 38.2%, 50%, and 61.8%.
- Support & Resistance: Defines areas where price will likely reverse and where price will stagnate to help in optimizing entry and exit levels.
- Combination Use: Works with other tools like candlestick patterns and moving averages for greater accuracy in both crypto and forex.
4. Bollinger Bands
These are indicators based on volatility and market conditions. Bollinger Bands consist of a moving average and two additional standard deviations, one positioned above and one below.

Bollinger Bands distinguish overbought and oversold market conditions, and possible break-out and break-down market conditions. In the crypto and forex markets, the prices over the upper band indicates overbought conditions, and those prices which touch the lower band indicates oversold conditions.
The bands are an indication of price movement, in the middle, they are expanding and contracting based on a volatility. Traders use the bands in combination with other indicators, in particular the oscillators like RSI and stochastic, to increase the effectiveness in highly volatile markets.
Bollinger Bands Features
- Volatility Measurement: Expand and contract depending on market volatility. They can expose breakouts and consolidations.
- Overbought/Oversold Signals: The price touching the upper band suggests overbought condition and the lower band suggests the opposite.
- Trend Analysis: Usually confirms trends and reversals when combined with RSI or other indicators.
5. Moving Averages (SMA/EMA)
SMA and EMA are the first types of indicators that are offered and they show the general price data in order to see the price data trends. SMA is simpler and it just takes the particular price average for a particular timeframe.
On the other hand, EMA takes less old prices into the calculation more often and thus, it is more responsive to recent changes. In crypto and forex trading, they obseve price trends, crossovers, and movable support and resistance.
In the middle of the chart, 50-day and 200-day moving average pairs are used to see price trends and reversals. For more effective strategies, they are paired with oscillators and Fibonacci. Moving averages are easy to use and help in trend analysis.
Moving Averages (SMA/EMA) Features
- Trend Identification: Overall trend directions can be revealed with the help of the SMA and EMA.
- Dynamic Support/Resistance: During uptrends and downtrends, moving averages provide support or resistance.
- Crossover Signals: Cross over of the EMA or SMA can show possible entry or exit signals for the traders.
6. Ichimoku Cloud
The Ichimoku Cloud combines multiple indicators into one comprehensive view of trend direction, momentum, and levels of support and resistance. It consists of five lines, Tenkan-sen, Kijun-sen, Senkou Span A, Senkou Span B, and Chikou Span.

In crypto and forex, traders assess the color and position of the cloud in relation to the price in order to make bullish and bearish calls.
Ichimoku indicators in the center of the chart help to identify potential reversals, breakout points, and optimal levels for entering and exiting the market. Ichimoku’s comprehensive nature makes it ideal for beginners, while more advanced traders appreciate the ability to assess market strength rapidly.
Ichimoku Cloud Features
- Trend Direction: The color and position of the cloud indicate the trend’s bullish or bearish direction.
- Support & Resistance: Cloud lines act as dynamic support and resistance zones.
- Momentum Indicator: Multiple lines for trend strength, possible reversals, and trade signals.
7. Stochastic Oscillator
The stochastic oscillator is a momentum indicator that compares a security’s closing price to its price range over a certain time frame. It is a value between 0 and 100, and is considered overbought if above 80, and oversold if below 20. In crypto and forex, traders use the stochastic to identify potential trend reversals, and entry and exit points.

It is often combined in the center of the chart and with other indicators like moving averages or Bollinger Bands for confirmation. The oscillator is valuable in a fast trading environment as it reveals diverging patterns and momentum shifts to help identify short-term market movements.
Stochastic Oscillator Features
- Momentum Measurement: Closing price and price range over time determine the price momentum.
- Overbought/Oversold Levels: The overbought threshold is above 80 and the opposite is below 20.
- Divergence Signals: Trend reversals, when the price and the oscillator diverge and move in opposite directions.–
8. Support & Resistance Zones
Support and resistance zones are critical price levels where buying or selling pressure historically reverses the trend. Support acts as a price floor, while resistance acts as a ceiling. In crypto and forex trading, identifying these zones helps traders predict potential reversal points, breakouts, and retracements.

The middle of the chart, combining these zones with candlestick patterns, moving averages, or Fibonacci levels increases precision. Knowing these zones allows traders to determine stop-loss and take-profit levels. Mastering these zones is crucial for managing risk and increasing the likelihood of profitable trades in highly unpredictable markets.
Support & Resistance Zones Features
- Trend Reversal Points: Find price levels where reverse order blocks and reverts trend. This is crucial for trade planning.
- Breakout Identification: When pricing crosses established zones, it helps indicate possible breakouts.
- Risk Management: This is key for determining stop-loss and take-profit levels.
9. Candlestick Patterns
Picturing price movements, candlestick patterns help traders determine possible market direction, especially in crypto and forex. Many candlestick patterns doji, engulfing, hammer, and shooting star display possible trend reverse or trend continuation.

Candlesticks can be combined with other technical indicators in the middle of the chart such as moving averages, stochastic or Fibonacci retracements. Using the shape, size, and position of a candlestick, traders can determine market sentiment.
Risk management, market psychology, and situational awareness in trading environments improve, for traders, with each candlestick pattern mastered and executed at the right time.
Candlestick Patterns Features
- Market Sentiment: Action pricing shows sentiment and visual representation, indicating bullish or bearish momentum.
- Reversal/Continuation Signals: Candlestick patterns such as doji, hammer, or engulfing indicate a potential trend change.
- Confirmation Tool: Patterns can be used with other indicators to increase trade decision accuracy.
10. Trendlines & Channels
In crypto and forex trading, where trendlines are used to chart and draw direction for price movements, connectors and price movements can also be used to draw parallel lines for the construction of the channel, giving the trader another tool.

Trendlines and channels help determine potential areas where price may reverse or breakout. In the middle of the chart, using trendlines with support and resistance, moving averages, or oscillators helps to improve forecasting accuracy.
Using channels, traders can visually track movements between support and resistance and scalping to targets becomes easier with the defined areas of the channel. Well constructed trendlines enable the trader to measure the market volatility and track down breakout with confidence.—
Trendlines & Channels Features
- Trend Identification: Trendlines connect highs or lows to determine sets discernible upward or downward market trends.
- Channel Trading: You can set movement within price boundaries using parallel drawn channel trendlines.
- Breakout Signals: When price break through trendlines and/or channels, this is a strong indication of potential breakouts.
Conclusion
Developing an understanding of technical analysis is crucial for anyone looking to participate within the crypto and forex markets. Automated trading and real time data allows services such as TradingView and MetaTrader 4/5 to provide efficient and precise analysis.
Fibonacci retracements, Bollinger Bands, moving averages, Ichimoku Clouds and stochastic oscillators all assist in determining trend and reversals to figure out the best entry/exit points. Market appreciation is further gained through understanding support and resistance zones, candlestick patterns, trendlines and channels.
The combination of all these tools allows a trader to make calculated and informed decisions while managing risk, and dramatically increasing the likelihood of profitability in the crypto and forex markets.
FAQ
Can the same tools be used for both crypto and forex trading?
Yes. Most technical analysis tools, such as TradingView charts, MT4/MT5 platforms, moving averages, and support/resistance zones, are effective in both crypto and forex markets. Although crypto markets are more volatile and operate 24/7, these tools help analyze trends, reversals, and momentum similarly to forex markets. Traders often adjust parameters to account for market behavior differences.
Which is the best platform for technical analysis?
TradingView and MetaTrader 4/5 are among the most popular platforms. TradingView offers advanced charting, customizable indicators, and a strong social community for sharing trading ideas. MT4/MT5 provides algorithmic trading, backtesting, and real-time market analysis. Both platforms support a wide range of technical indicators, making them ideal for both beginner and professional traders.
How do moving averages help in trading?
Moving averages (SMA and EMA) smooth out price data to reveal trends and potential support/resistance levels. They help traders identify trend direction, confirm reversals, and generate crossover signals. For instance, a shorter-term EMA crossing above a longer-term EMA may indicate a bullish trend. In crypto and forex, moving averages are often combined with other indicators for better decision-making.


