
Investing is not only about buying stocks or watching the market prices. Investors need reliable tools to track portfolio performance, research companies, analyze financial data and understand potential risks.
There are so many investment platforms out there and picking the right one can make portfolio management easier and more organized. This article will cover the Best Portfolio Tracking and Investment Research Tools that provide useful features for analyzing investments, tracking performance, and helping you make smarter financial decisions in the long run.
What Are Portfolio Tracking and Investment Research Tools?
Portfolio Tracking and Investment Research Tools These software platforms help investors to monitor their investments, analyze financial markets, and evaluate investment opportunities. These tools offer features such as portfolio performance tracking, asset allocation, stock screening, financial analysis, dividend tracking, and risk assessment.
Investors can use them to review their holdings, compare historical returns, research companies, and understand how diversified their portfolios are. They combine investment data and analytical features to help investors make smart financial decisions, improve portfolio management and work toward their long term financial objectives.

Why Are Portfolio Tracking and Investment Research Tools Important?
Monitor Portfolio in Real Time: These tools allow investors to monitor their investment holdings, track market movements and analyze portfolio values to be aware of their financial positions.
Monitor Investment Performance: Investors can view their portfolio returns, compare past performance, and assess if their investments are on track to achieve their financial objectives.
Better Asset Allocation: Such platforms offer insights into how investments are allocated across stocks, bonds, ETFs, and other assets, helping investors understand their portfolio’s balance.
Investment Research: They offer company financials, valuation measures, analyst perspectives, and stock screening tools to help investors assess potential investment opportunities.
Risk Assessment: Portfolio analytics help identify concentrated holdings, market exposure, volatility and gaps in diversification that can impact overall investment performance.
Dividend & Income Tracking: Investors can track dividend payments, investment income, yields and distribution history to understand income generated by their portfolios.
Better investment choices: With financial data and research reports, market trends, and comparison tools at their disposal, investors have the ability to make more informed choices rather than investing based on speculation alone.
Long Term Financial Planning: Historical performance reports, portfolio analysis and investment projections are used by investors to assess their strategies and adjust them to meet changing financial objectives.
Key Points
| Platform | Key Features |
|---|---|
| Morningstar Investor | Stock and fund ratings, Portfolio X-Ray, valuation analysis, analyst research, portfolio monitoring |
| Stock Rover | Fundamental research, financial ratios, stock screeners, portfolio analytics, dividend tracking |
| Seeking Alpha | Quant Ratings, analyst opinions, earnings analysis, financial statements, stock comparisons |
| Koyfin | Financial dashboards, market data, charting, company financials, portfolio analysis |
| Sharesight | Performance reporting, dividend tracking, capital gains calculations, tax reports, broker integrations |
| Empower Personal Dashboard | Investment tracking, asset allocation, retirement planning, fee analysis, account aggregation |
| Portfolio Visualizer | Historical backtesting, Monte Carlo simulations, asset allocation analysis, portfolio optimization |
| Simply Wall St | Snowflake analysis, financial health assessments, valuation analysis, dividend research, stock comparisons |
| TradingView | Advanced charts, technical indicators, stock screeners, price alerts, watchlists |
| Yahoo Finance | Portfolio watchlists, market news, stock quotes, financial statements, historical performance |
1. Morningstar Investor
Morningstar Investor is a premium research and portfolio analysis platform that is best for long-term investors who want independent fund and stock research. It tracks holdings, performance, fees and stock overlap and its X-Ray tool breaks a portfolio down into asset classes, sectors, regions and underlying holdings.
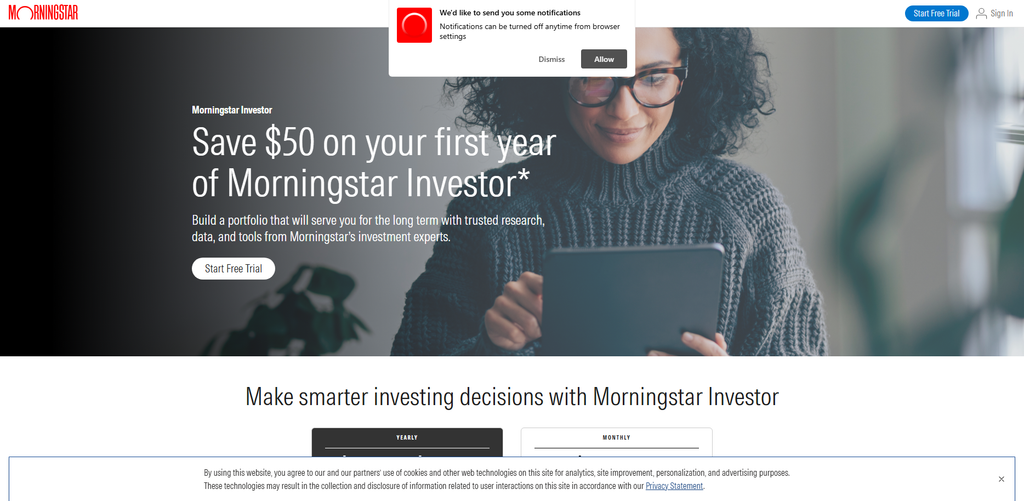
Screeners with over 200 data points, analyst reports, ratings, news alerts and saved portfolio views are available to investors. Its strength is in fund analysis and valuation research, not active trading. Pricing is about $34.95 a month with an annual plan of about $249. There is no meaningful free tier.
Key Features
- Portfolio X-Ray: Review of portfolio holdings, asset allocation, sector exposure and diversification.- Investment Research: Offers analyst research, stock reports and investment insights.
- Morningstar Ratings: Provides star ratings and analyst ratings for stocks and funds that qualify.
- Performance Tracking: Tracks portfolio returns and compares how your investments are performing.
- Fund Analysis: Offers in-depth details on mutual funds, ETFs, costs and holdings.
Risk Assessment
- Sets out the portfolio’s concentration by securities and sectors.
- Focuses on overlapping holdings that may dilute the effectiveness of diversification.
- Helps assess investment risk by analyzing volatility and asset allocation.
- Aids in risk assessment by historical performance and investment research.
2. Stock Rover
Stock Rover is a data-driven stock screening, research and portfolio management platform for the fundamental investor. It has hundreds to over 800 metrics, detailed company comparisons, watchlists, alerts, charts and portfolio analytics including risk, correlation and future-income estimates. The user can connect brokerage accounts, monitor holdings, and analyze performance over long historical time periods.
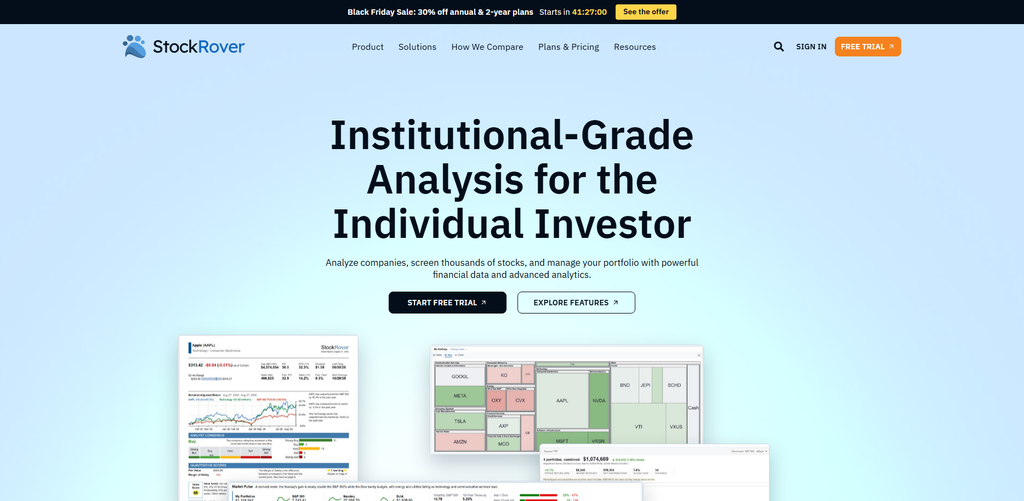
Its screening tools are particularly adept at finding value, growth, dividend and quality stocks. Paid plans start around $29/month, with higher tiers adding longer histories, custom equations, ETF/fund reports and more advanced metrics. Perfect for investors who believe in numbers, research and systematic approach.
Key Features
- Stock Screener: Filter stocks based on fundamental indicators, financial ratios and valuation measures.
- Portfolio tracking: Keep tabs on your holdings, returns, dividends, and overall portfolio performance.
- Financial Research: Delivers detailed financial statements, company fundamentals and historical data.
- Investment Comparison: Compares companies on profitability, growth, valuation and financial strength.
- Dividend Analysis: Provides dividend yields, growth rates, payment history and income potential.
Risk Assessment
- Assesses debt, profitability and liquidity to measure financial strength
- Assists in locating overvalued stocks by means of valuation ratios.
- Considers portfolio diversification and exposure to individual positions.
- Lets you see the historical volatility and performance of the investment to help you evaluate it.
3. Seeking Alpha
Seeking Alpha is a combination of crowd-sourced investment articles and professional-level research, earnings data, ratings and portfolio tools. Quant Ratings system evaluates stocks based on more than 100 financial and market metrics. It includes analyst ratings, dividend grades, earnings estimates, transcripts, and bull-and-bear arguments.
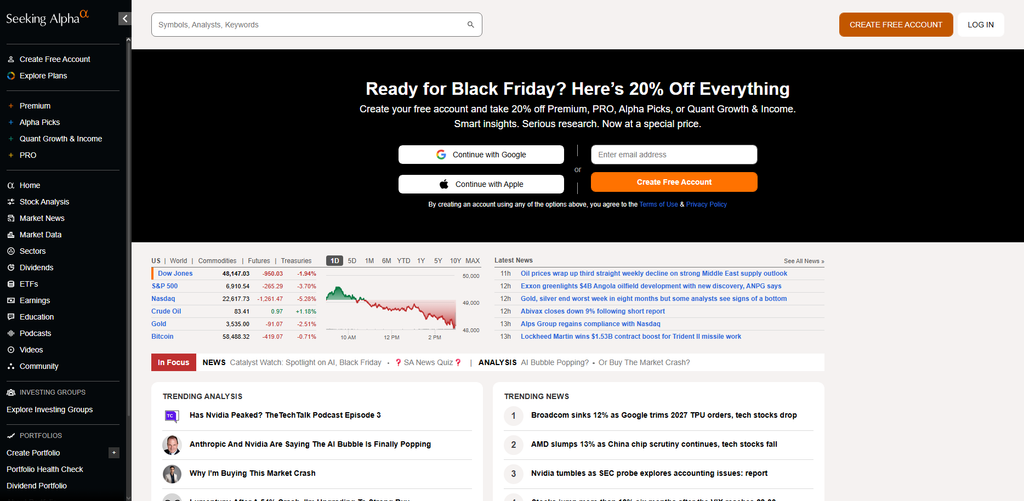
Portfolio tracking features include alerts, holdings analysis and research integration, making it useful for investors looking for ideas as well as analysis. It is particularly robust for stock-specific research and earnings-oriented investing. Seeking Alpha Premium is priced at about $215 in the first year, then $299 a year. No full free research tier.
Main Features**
- Quant Ratings: Offers quantitative stock ratings for many investment factors.
- Analyst Research: Investment analysis, market commentary and stock recommendations.
- Earnings Analysis: Discusses company earnings reports, financial results and earnings expectations.
- Stock Comparison: Compare companies based on valuation, profitability, growth and momentum metrics.
- Portfolio Monitoring: Allows investors to monitor holdings, stock performance and investment news.
Risk Evaluation
- Identifies financial weaknesses by applying fundamental analysis to the company.- Assesses valuation risks based on financial metrics and benchmarking.
- Gives insights on downside through analyst opinions and investment research.
- Helps evaluate market and company risks using earnings coverage and financial updates.
4. Koyfin
Koyfin is a modern financial data and charting platform. Fusing company fundamentals, market data, screeners, dashboards and portfolio tracking. It offers global stocks, ETFs, mutual funds and economic data to help investors create custom watch lists, charts, financial tables and research perspectives. Its portfolio tools enable users to track holdings across markets and its visual dashboards make financial trends easier to read.
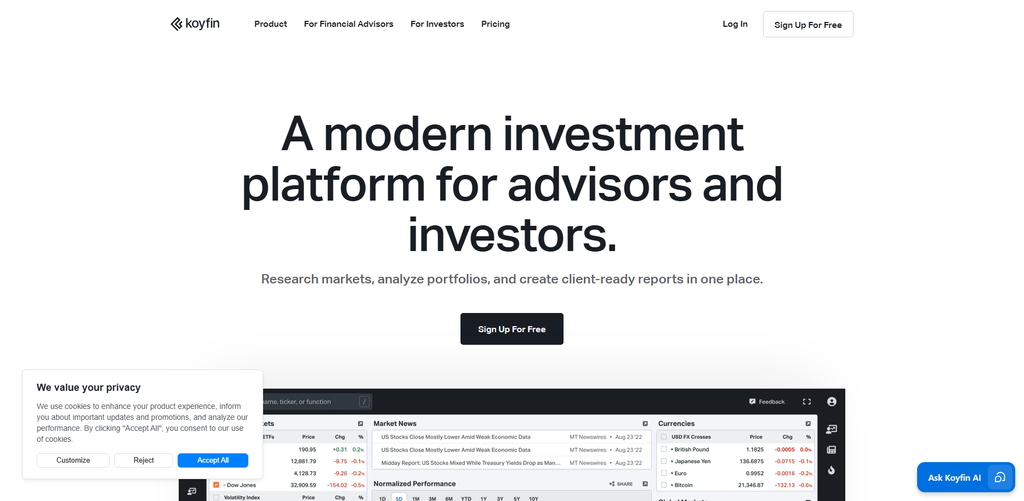
Koyfin is especially appealing to self-directed investors who want Bloomberg-style visualization of data for less money. It has a generous free plan for basic dashboards, with paid plans that unlock longer data histories, more screeners, transcripts, and advanced research features.
Features**
- Financial Dashboards: Tailored dashboards to track financial markets and investments.
- Market Data: It provides market data for stocks, ETFs, bonds, currencies and other assets.
- Advanced Charting: Interactive charts, technical indicators, and historical market comparisons.
- Company Analysis: Financial statements, valuation metrics and basic company data.
- Portfolio Analytics: Allows to track investments holdings and analyze portfolio performance.
Risk Evaluation
- allows you to look at your portfolio’s exposure to different asset classes and securities.
- Assists in evaluating volatility from historical price and performance data.
- It helps you find potential overvalued investments by looking at valuation metrics.
- Allows you to compare the financial performance and market sensitivity of investments.
5. Sharesight
Sharesight is a portfolio performance tracker that is designed to accurately measure real investment returns. It tracks purchases, sales, dividends and distributions and then calculates true performance taking into account income, currency effects and holding period returns. Investors can link brokerage accounts or enter holdings manually, track multiple portfolios, and view allocation, diversification, tax and dividend-income reports.
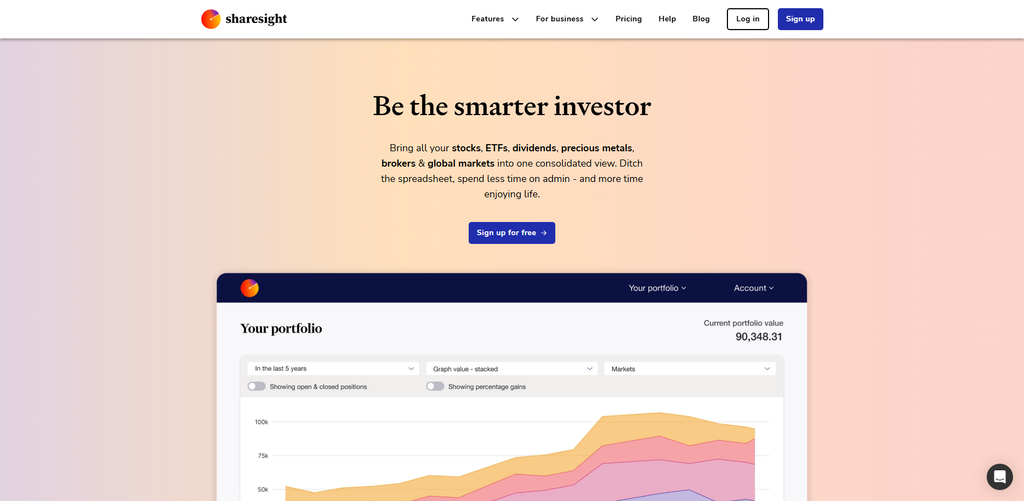
For longer-term investors with international holdings, its annualized performance and benchmark comparison tools are particularly helpful. Sharesight’s free plan supports a limited number of holdings. Paid plans start at around $84 per year, with higher tiers supporting more portfolios, holdings and reporting features.
Important Features
- Portfolio Performance: Uses performance and portfolio reporting tools to monitor investment returns.
- Dividend Tracking: Monitors dividend payments, income history and investment distributions.
- Capital Gains Reporting: Computes capital gains and losses for supported markets and tax systems.
- Broker Integrations: Import investment transactions from supported brokers and platforms.
- Portfolio Reporting: Create investment performance, income and tax reports.
Risk Factors
- Determines portfolio concentration in holdings and asset classes.
- Monitors investment performance to identify lagging or underperforming positions.
- Portfolio allocation reports to help you assess diversification.
- Helps with historical risk assessment based on investment returns and performance data.
6. Empower Personal Dasboard
Empower Personal Dashboard is a free, all-in-one personal-finance and investment-tracking platform. It links bank accounts, credit cards, loans, retirement accounts, brokerages and crypto holdings to display net worth, spending, cash flow and investment performance in one place.
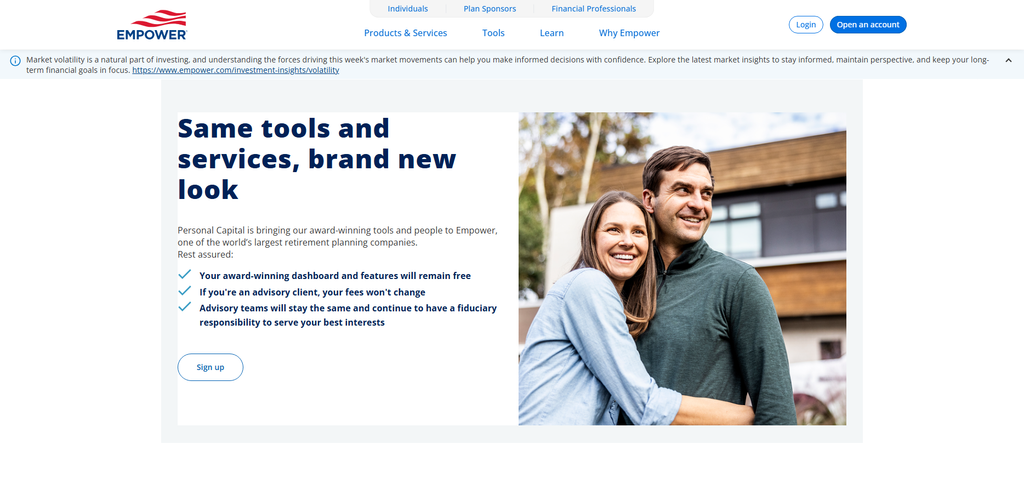
Investment Checkup compares your portfolio to your target allocation, highlights imbalances and provides rebalancing recommendations based on risk and retirement goals.
The Retirement Planner can show examples of early retirement or market downturns. The dashboard and financial tools are free, but Empower’s managed advisory service charges an annual fee based on assets under management.
Features
- Investment Tracking: Connects financial accounts to monitor investment holdings.
- Net Worth Calculation: Adds up all financial assets and liabilities to determine total net worth.
- Asset Allocation: This shows how your investments are divided among stocks, bonds, cash and other investments.
- Retirement Planning: Offers retirement calculators and planning tools.
- Fee Analyzer: Helps you see investment fees and how they may affect you over the long term.
Risk Evaluation
- Helps to recognize potential long-term returns reductions due to fees.
- Highlights concentration in portfolios and allocation imbalances.
- Assesses the investment diversification among asset classes.
- Offers retirement projections to help you understand the impact of various assumptions on your financial objectives.
7. Portfolio Visualizer
Portfolio Visualizer is a specialized portfolio analysis and backtesting site for do-it-yourself investors, financial planners and quantitative types. Users can evaluate historical returns, measure risk, test asset allocations, compare model portfolios and examine correlations between assets. The tools include Monte Carlo simulations, factor analysis, optimization, regression and fund-screening capabilities.
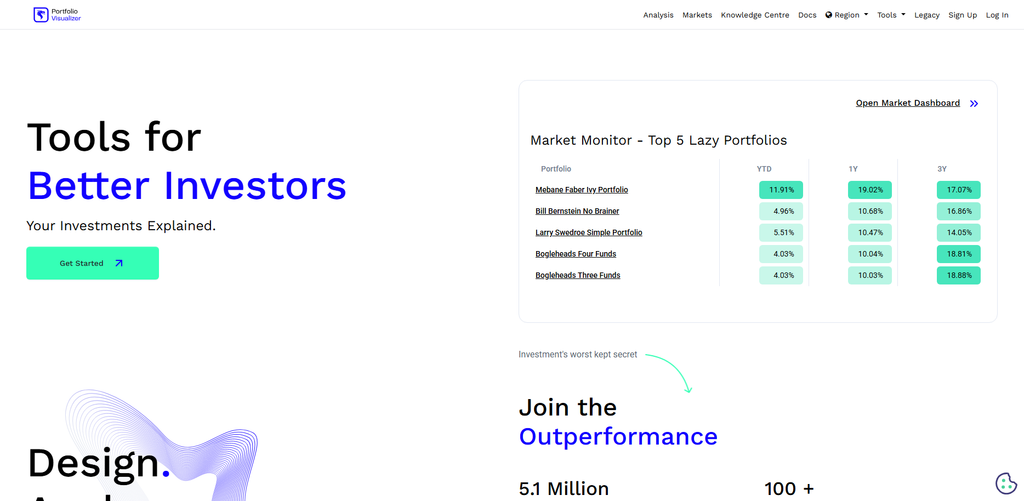
It is not a brokerage-style tracker but rather one that focuses less on daily trade management and more on understanding how a portfolio might have behaved historically and how allocation choices affect risk and return. It provides free basic tools and paid subscriptions unlock more portfolios, longer histories, advanced analytics and more modeling options.
Key Features
- Portfolio Backtesting: Performs historical analysis of portfolio returns given chosen assets and weights.
- Monte Carlo Simulation: Utilizes statistical simulations to model future outcomes of the portfolio.
- Portfolio Optimization: Looks at asset mixes to review various allocation strategies.
- Asset Allocation: Examines the portfolio’s division between stocks, bonds and other investments.
- Historical Analysis: Portfolio behavior comparison, investment returns and benchmarks.
Assessment of Risk
- Measures of standard deviation and historical volatility.
- Measures peak drawdowns in times of market downturn.
- Employs Monte Carlo simulations to determine potential range of outcomes.
- Looks at risk adjusted returns using measures like sharpe ratio.
8. Simply Wall St.
Simply Wall St have a “Snowflake” analysis that takes the hard work out of researching a company and gives you a quick summary of value, future growth, past performance, financial health and dividends. It covers global stocks, and helps investors to understand the basics of a company quickly without reading lengthy reports.
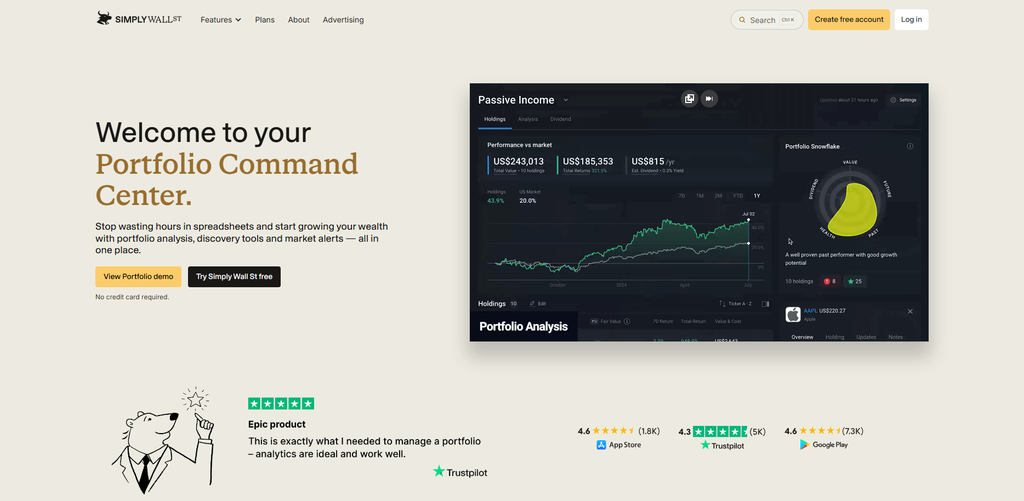
Portfolio tracking includes holdings analysis, alerts and strategy assessment. Valuation tools highlight whether shares may be over- or undervalued. It is ideal for novice and intermediate investors who like simple, visual insights rather than complicated spreadsheets. There’s a free tier, and Premium costs about $120 a year for three portfolios, with an Unlimited plan for more access.
Highlights
- Snowflake Analysis: Visual financial assessments of company fundamentals.
- Stock Research: Delivers details on company financials, business performance and valuation.
- Valuation Analysis: Useful in determining whether stocks are overvalued or undervalued.- Dividend Research: Shows dividend yields, payment history, and indicators of dividend sustainability.
- Portfolio Tracking: enables investors to track their holdings and assess portfolio performance.
Assessment of Risk
- Financial health concerns highlighted through company fundamental analysis.
- Assesses debt levels and financial stability
- Offers fair value estimates to highlight potential valuation risks.
- Visual research assessments highlight business and earnings related concerns.
9. TradingView
TradingView is primarily a charting and technical analysis platform, but it also features portfolio tracking for stocks, ETFs, crypto and other assets. You can upload your trading history and view your portfolio value, unrealized gains, annualized yield, transaction logs and performance against benchmarks.
Its analytical features include sector concentration, risk metrics, Beta, Sharpe ratio, Sortino ratio, as well as TradingView’s powerful charts, indicators, screeners, and community ideas. It is particularly useful to active traders and technical-minded investors. The Basic plan is free, and paid plans start at around $12.95 per month billed annually. Higher tiers include charting features and the number of portfolios.
Main Features
- Advanced Charting: Users can build their own charts to analyze price trends and market movements.
- Technical Indicators: Supports indicators, drawing tools and technical analysis techniques.
- Stock Screeners: Filters stocks based on financial and technical criteria.
- Price Alerts: Notifies you when chosen market conditions or price levels are hit.
- Watchlists: Stocks, ETFs, currencies and cryptocurrencies investors can follow and organize.
Risk assessment
- Assists in spotting volatility by price charts and technical indicators.
- Allows drawdown analysis and historical price movement
- Gives you tools to monitor price levels and possible trend changes.
- Enables you to measure market exposure by watching several assets and securities.
10. Yahoo Finance
Yahoo Finance is a widely available and popular market-data and portfolio-tracking platform for casual and mainstream investors. Its free service offers quotes, news, watchlists, basic portfolios, earnings calendars and market research. Premium portfolios offer holdings sync with 100+ institutions, allocation heatmaps, unrealized returns, risk analysis, volatility metrics, and data import/export.
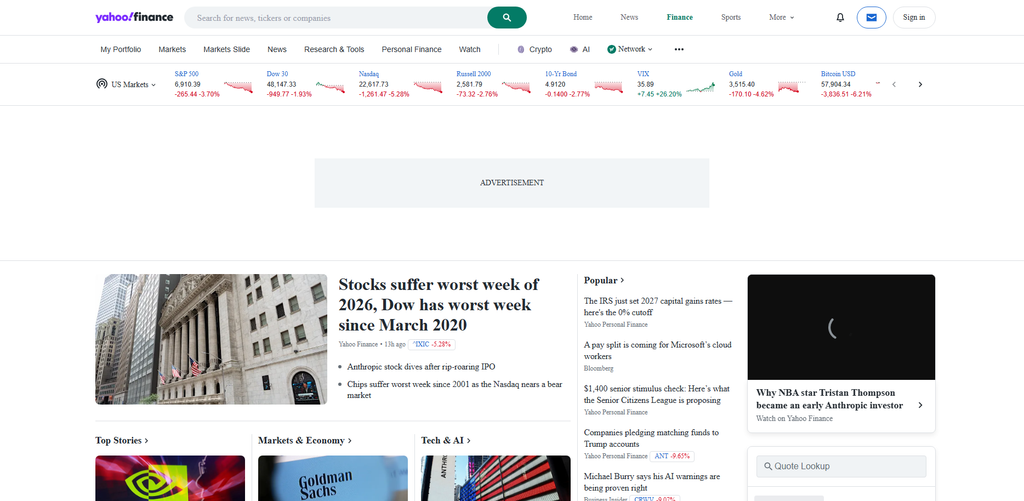
Higher tiers add expert stock picks, Morningstar ratings, research reports, model portfolios and fair-value analysis. Yahoo Finance is inexpensive and simple to use, but it’s not as in-depth in its research as dedicated platforms like Morningstar or Stock Rover. The paid plans are between $7.95 and $39.95 per month.
Key Features
- Portfolio Tracking: Allows users to build watchlists and track their investments.
- Market Data: Stock prices, market data, historical financial information.
- Financial Statements: Provides company income statements, balance sheets, and cash flow data.
- Investment News: Covers financial news, market updates and company announcements.
- Stock Research: offers valuation metrics, analyst data, earnings information and company comparisons.
Risk Assessment
- Financial statements help in assessing the financial risks of the company.
- Supports valuation analysis using key financial ratios.
- Allows investors to track the performance of their portfolio and individual stock price movements.
- Provides market news and earnings updates to catch potential investment concerns.
Conclusion
Investors need portfolio tracking and investment research tools to keep track of their investments, analyze market performance and make informed investment decisions. Nice features for tracking your portfolio, researching investments, allocating your assets and analyzing risk can be found on websites such as Morningstar Investor, Stock Rover, Seeking Alpha, Koyfin, Sharesight and Empower Personal Dashboard.
Other tools that can help with investment comparisons and market analysis include Portfolio Visualizer, Simply Wall St, TradingView and Yahoo Finance. What’s the best platform for you depends on your investment goals, research needs, supported assets, pricing and analytical features. The right tool can enhance portfolio visibility, diversification and long-term investment planning.
FAQ
What Are Portfolio Tracking and Investment Research Tools?
These are software platforms that help investors monitor investment holdings, analyze portfolio performance, research stocks, track dividends, and evaluate financial opportunities.
Which Are the Best Portfolio Tracking and Investment Research Tools?
Some popular options include Morningstar Investor, Stock Rover, Seeking Alpha, Koyfin, Sharesight, Empower Personal Dashboard, and Portfolio Visualizer.
Are Portfolio Tracking Tools Suitable for Beginners?
Yes, many tools offer watchlists, portfolio dashboards, performance reports, and basic investment research features that help beginners understand and monitor their investments.
Can Portfolio Tracking Tools Monitor Multiple Investments?
Yes, depending on the platform, investors can track multiple stocks, ETFs, mutual funds, bonds, and other supported assets in one place.
Which Tools Are Best for Stock Investment Research?
Morningstar Investor, Stock Rover, Seeking Alpha, Koyfin, and Simply Wall St offer stock research, financial analysis, valuation metrics, and company information.